This is the VIX-Yield Curve Cycle Graph, the most valuable chart that few, if any, ever look at.
The cycle has four phases.
1. Recession: yield curve moves from flat to steep (upward slope), equity volatility is relatively high.
2. Early-stage recovery: yield curve remains steep, equity volatility begins to fall.
3. Mid-stage expansion: the yield curve starts to flatten, equity volatility remains low.
4. Late-stage expansion: yield curve becomes even flatter, equity volatility soars as fears of recession dominate investor behavior.
As can be seen from the VIX-Yield Curve cycle graph we are in the late expansion territory. Late-stage expansion follows and this can be expected between 2024 and 2025. What is the significance between looking at nominal yield spreads and VIX as a reflexive value to cycles of expansion and contraction is largely because markets have structured a mechanism to generate value (i.e. yield) from volatility by taking advantage of a spurious pattern whereby future volatility is expected to go down relative to present volatility if it has expanded (i.e. commonly used as a signal VIX @$15 is risk off, VIX above $30 is risk on; however, these are not signals but conditions of the market structure with respects to illiquidity) this generates an arbitrage that can be used to carry risk. This has to do with what phase of the cycle we are in, due to a quirk in market behavior. During Recessions, carry crashes generally occur. What generally occurs in carry crashes is there is a catalysts that creates a run for cash that is always imbalanced by margins used by hedge funds to lever up. This is because there is an arbitrage between cash futures basis that over the last 7 years or so existed due to a disconnect between cash and future prices of treasuries (i.e. likely due to a future expectation of lower rates or rates at zero due to QE [Bernanke put] after 2008). Due to having essentially a ‘risk free asset’ placed as collateral through a futures contract to obtain cash and margin on future value to put money into the markets. This works so long as rates stay low or at zero. As rates began to rise market found itself in various conundrums of illiquidity driving volatility to decompress. The fed intervened. We entered the early stage of expansion In the early stage of an expansion everything, whether good or bad fundamentally, is bid up (i.e. pumped) and the difference in the extrinsic value of the stock price to the intrinsic is large enough whereby selling options on the stock becomes extremely profitable (i.e. up/down shadow gamma, as more than 90% of all 0DTE options are either unwound or netted off before the end of the trading day. Consequently, the effects of intraday volatility suppression are likely to diminish as the trading day progresses. In contrast, the supply and demand dynamics for gamma in longer-dated options differ significantly from those in 0DTE options. *The JPM estimations of overnight gamma imbalance, based on options with a duration of one day or more (>=1DTE), reveal a notable bias towards investors being long gamma while dealers hold a short gamma position.) These are generally created by some a level of implied volatility (i.e. expected future volatility) that can be shorted. Hence, the pump and dump mechanics once we begin entering the mid-stage expansion, where traders begin to look at more stable companies whose cash flow or reserves are on par with a standardized wisdom of the average for pricing the stock with moderate price action range. Thus, creating the next phase of expansion, which creates a pareto optimization in the market where there is an inequality in a small group of companies driving the main liquidity of market. People seek stability over time, managing volatility causes stress so people reduce that by seeking more manageable price action to ensure profitable trades or consistent gains from investments. Because these companies generated a Pareto optimization (1/3)
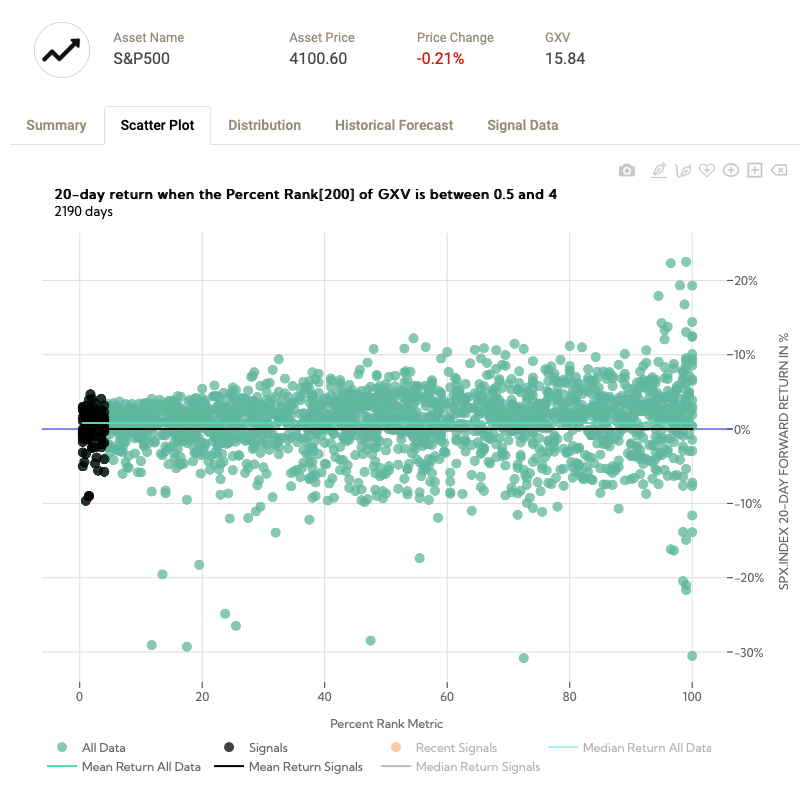
The SPX had a 5% gain in 20 days following the previous highest percentile signal. Well above the .7% average. Now we're at the lowest percentile, slightly skewed to the downside but with little RV expected. Hard to imagine given the catalysts.
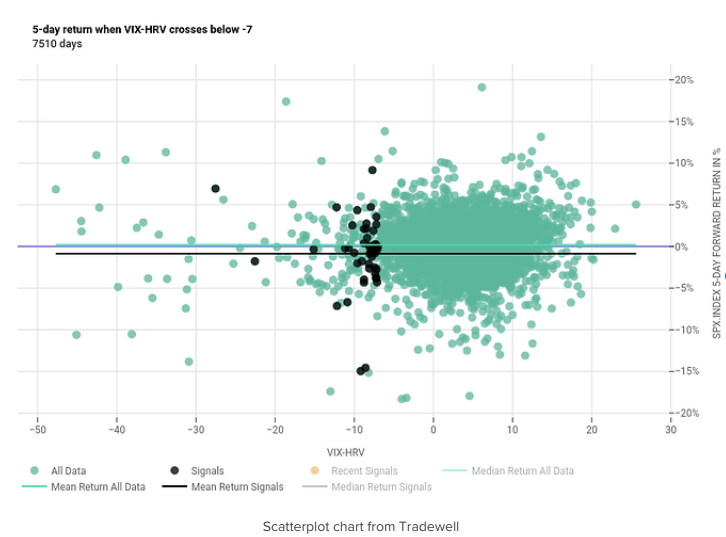
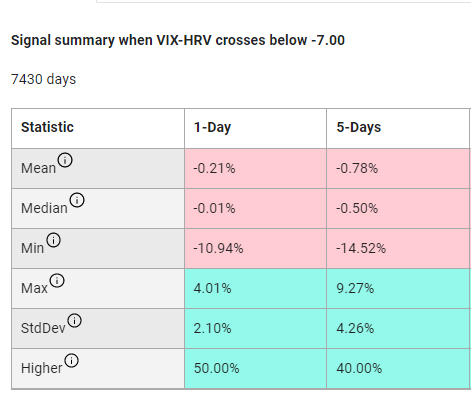
Over the weekend I wrote an article for Traderade members discussing how a when the discount between 1-month $VIX and realized volatility becomes greater than -7 we have a 64% chance of negative 5-day forward returns.
In other words, a poorly hedged and more fragile market.
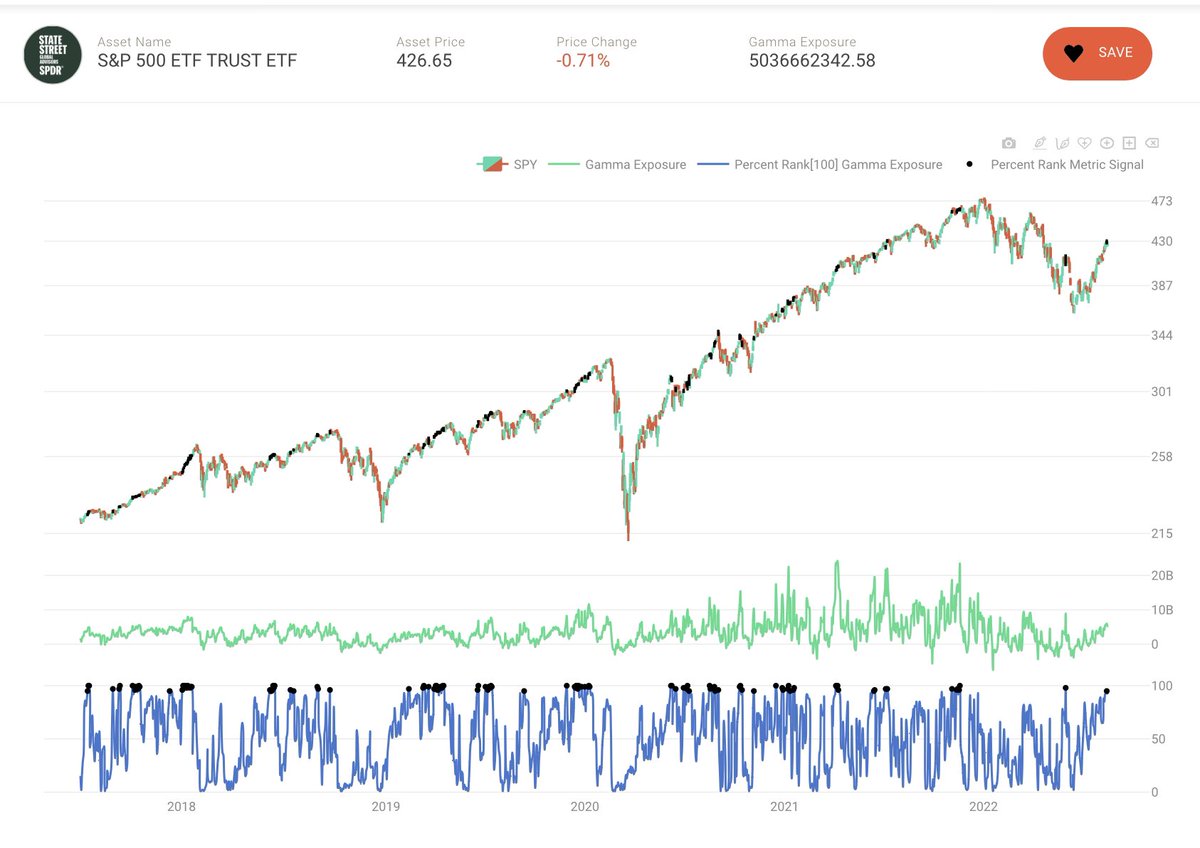
Current Gamma exposure is in the 92nd %tile, suggesting there’s not much juice left in this rally. It also creates a beautiful 42 day distribution with fat tails and a lot of opportunity. Chart made with @TradewellApp w/ data from @SqueezeMetrics
#SPX stocks above 100MA. Looks like one more leg down (or two in the case of '08) if we're going to continue the pattern. Chart made with @TradewellApp
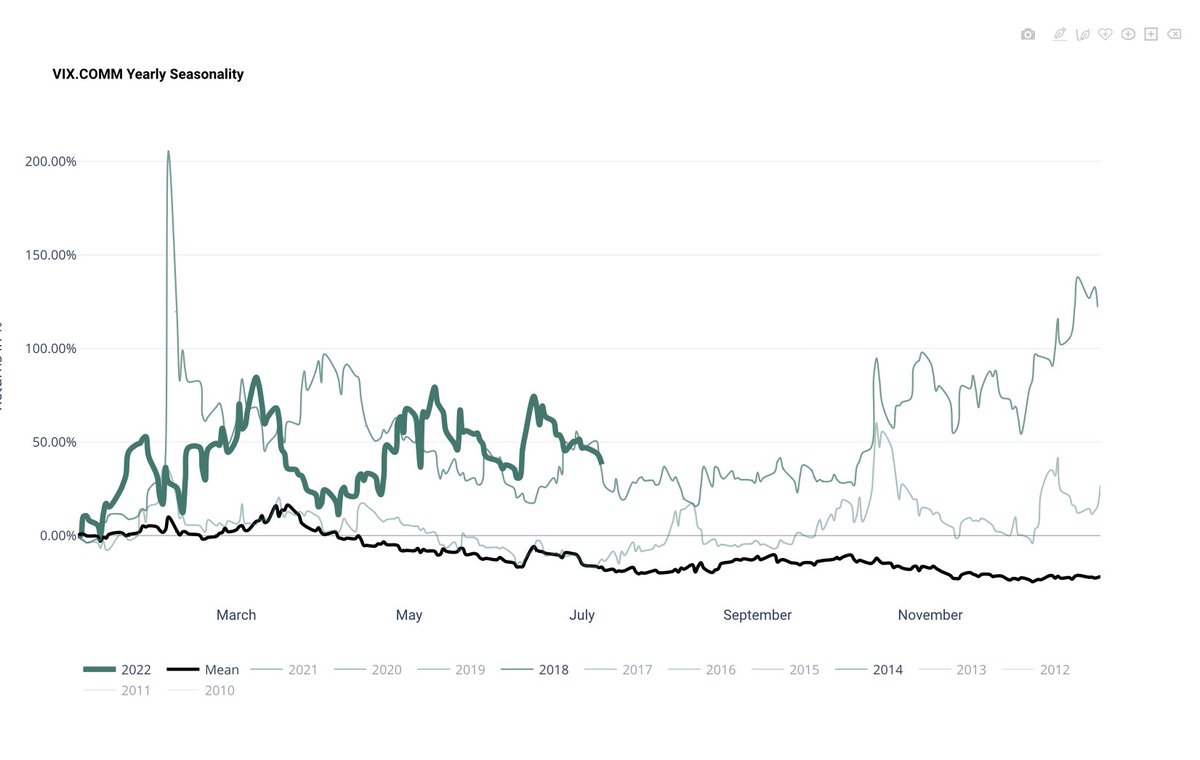
We are approaching what is usually the least volatile time of the year. Here is this years #VIX compared to the mean and last two midterm years. Will this time be different? Chart made with @TradewellApp
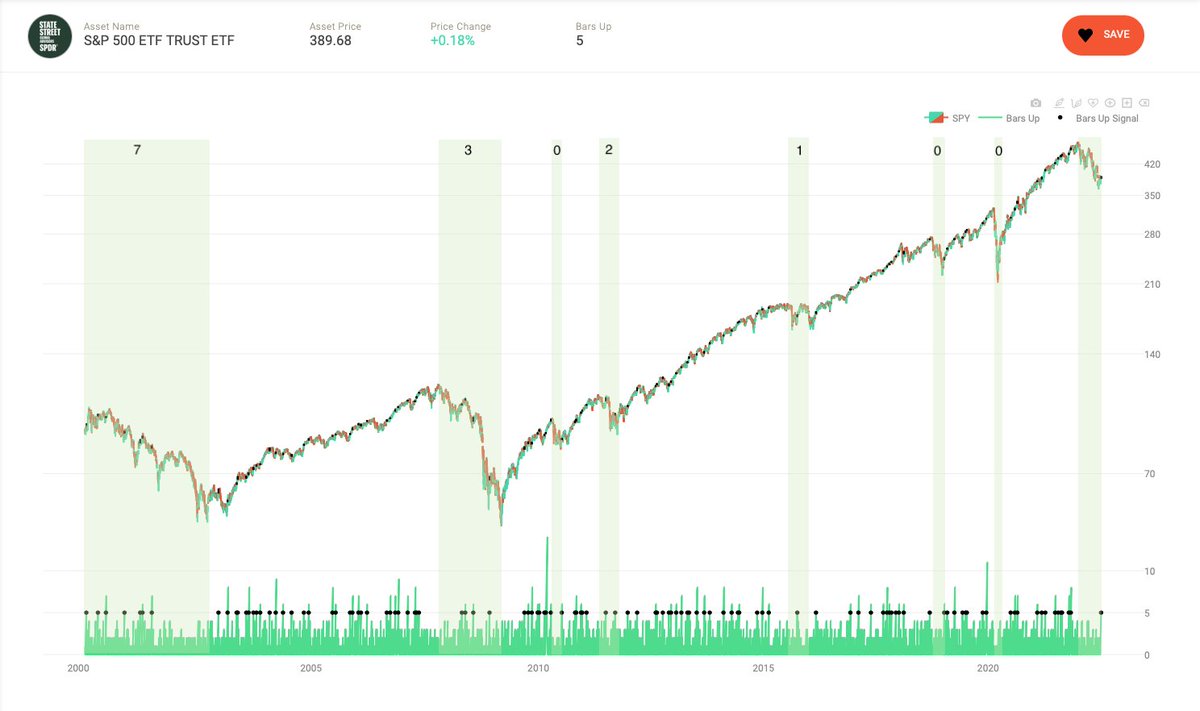
@TradewellApp $SPX win streak ended at 4 but $NDX is now at 5. There have been 116 5-day (or more) win streaks since 2000, only 8 of which occurred during major drawdowns and basically all of those were 2000-02
There have been 112 5-day (or more) win streaks since 2000. They are a feature of bull markets. Just 13 occurred during major drawdowns (shading) and most of those were March 2000-July 2001. Chart from @TradewellApp
#AMZN volatility seems to correlate with major bottoms in #SPY more so than the volatility of dozens of other stocks, indexes, and ETF’s I’ve tested. Also implying at least another 60 days of heavy volatility, the only quantile of it’s kind. Made with @TradewellApp







![LyfeOfPELK's tweet photo. This is the VIX-Yield Curve Cycle Graph, the most valuable chart that few, if any, ever look at.
The cycle has four phases.
1. Recession: yield curve moves from flat to steep (upward slope), equity volatility is relatively high.
2. Early-stage recovery: yield curve remains steep, equity volatility begins to fall.
3. Mid-stage expansion: the yield curve starts to flatten, equity volatility remains low.
4. Late-stage expansion: yield curve becomes even flatter, equity volatility soars as fears of recession dominate investor behavior.
As can be seen from the VIX-Yield Curve cycle graph we are in the late expansion territory. Late-stage expansion follows and this can be expected between 2024 and 2025. What is the significance between looking at nominal yield spreads and VIX as a reflexive value to cycles of expansion and contraction is largely because markets have structured a mechanism to generate value (i.e. yield) from volatility by taking advantage of a spurious pattern whereby future volatility is expected to go down relative to present volatility if it has expanded (i.e. commonly used as a signal VIX @$15 is risk off, VIX above $30 is risk on; however, these are not signals but conditions of the market structure with respects to illiquidity) this generates an arbitrage that can be used to carry risk. This has to do with what phase of the cycle we are in, due to a quirk in market behavior. During Recessions, carry crashes generally occur. What generally occurs in carry crashes is there is a catalysts that creates a run for cash that is always imbalanced by margins used by hedge funds to lever up. This is because there is an arbitrage between cash futures basis that over the last 7 years or so existed due to a disconnect between cash and future prices of treasuries (i.e. likely due to a future expectation of lower rates or rates at zero due to QE [Bernanke put] after 2008). Due to having essentially a ‘risk free asset’ placed as collateral through a futures contract to obtain cash and margin on future value to put money into the markets. This works so long as rates stay low or at zero. As rates began to rise market found itself in various conundrums of illiquidity driving volatility to decompress. The fed intervened. We entered the early stage of expansion In the early stage of an expansion everything, whether good or bad fundamentally, is bid up (i.e. pumped) and the difference in the extrinsic value of the stock price to the intrinsic is large enough whereby selling options on the stock becomes extremely profitable (i.e. up/down shadow gamma, as more than 90% of all 0DTE options are either unwound or netted off before the end of the trading day. Consequently, the effects of intraday volatility suppression are likely to diminish as the trading day progresses. In contrast, the supply and demand dynamics for gamma in longer-dated options differ significantly from those in 0DTE options. *The JPM estimations of overnight gamma imbalance, based on options with a duration of one day or more (>=1DTE), reveal a notable bias towards investors being long gamma while dealers hold a short gamma position.) These are generally created by some a level of implied volatility (i.e. expected future volatility) that can be shorted. Hence, the pump and dump mechanics once we begin entering the mid-stage expansion, where traders begin to look at more stable companies whose cash flow or reserves are on par with a standardized wisdom of the average for pricing the stock with moderate price action range. Thus, creating the next phase of expansion, which creates a pareto optimization in the market where there is an inequality in a small group of companies driving the main liquidity of market. People seek stability over time, managing volatility causes stress so people reduce that by seeking more manageable price action to ensure profitable trades or consistent gains from investments. Because these companies generated a Pareto optimization (1/3)](https://pbs.twimg.com/media/F7Nz7t4WwAA2oD7.jpg)