- Sharpe ratio - Imagine if the distribution of returns had a regular (Gaussian) bell curve shape. The Sharpe ratio shows how wide the bell is. Steeper bell is better.
- Sortino ratio - Same as Sharpe, but we only care about the left half. Steep left half is better (smaller tails).
- Omega ratio - We know that the distribution of returns is non-gaussian (the bell has irregular shape). Let's measure the the area under the curve for the left/down part and for the right/up part. The ratio between the two is called the omega ratio.
- Rachev ratio - Same as Omega, but let's find only the degen assets, we only care about the tails of the curve. Let's find which ones have the fattest tails.
https://t.co/1BWzlpV9sB
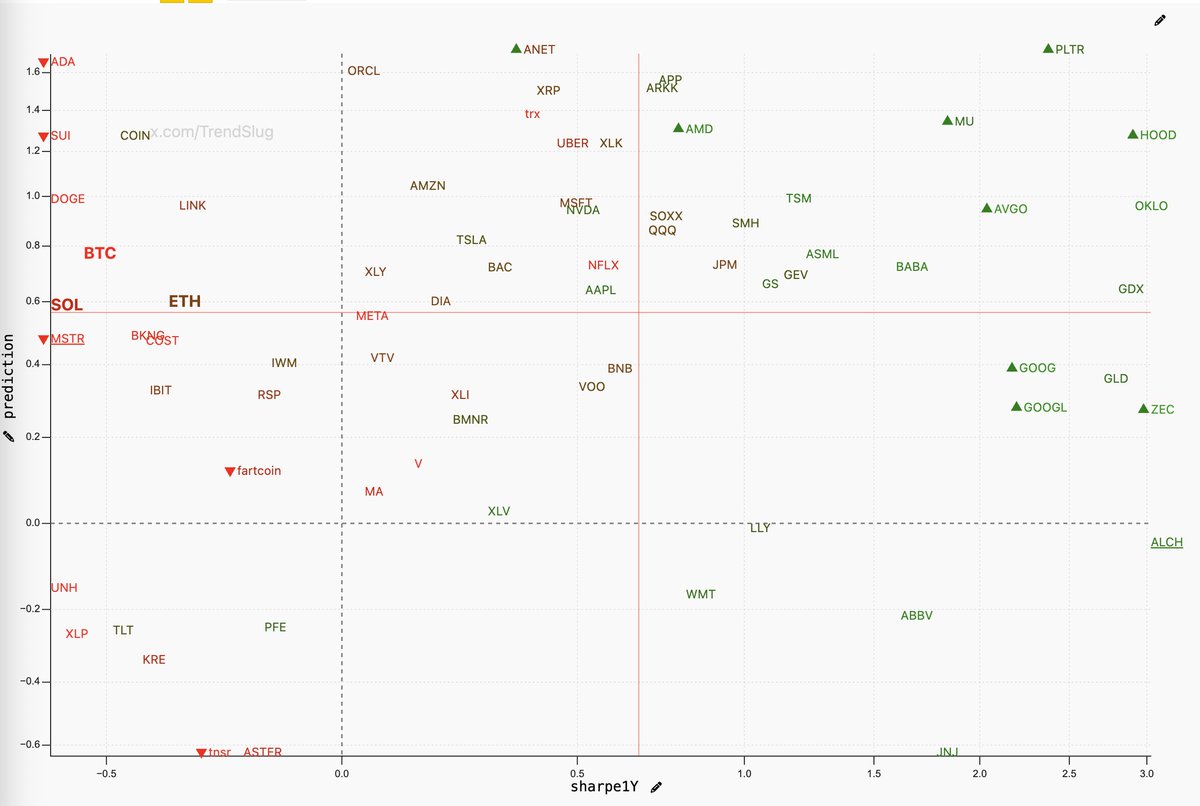
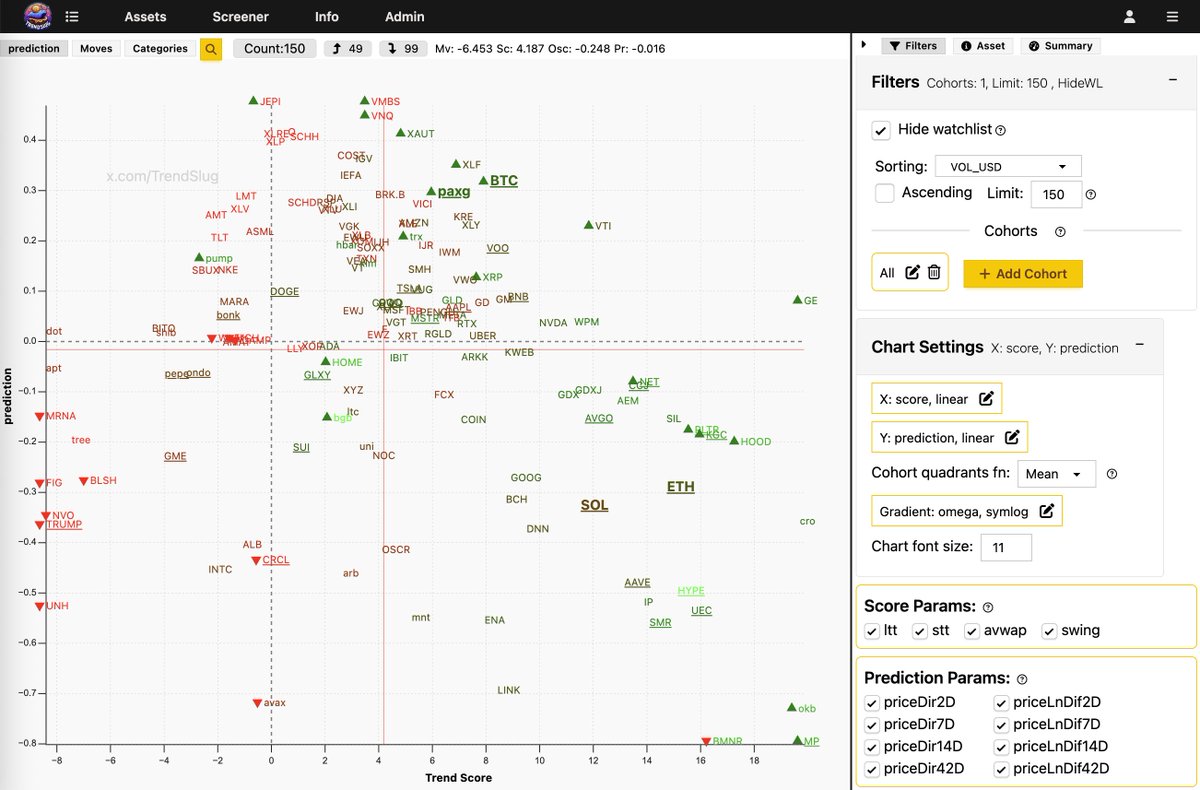
After the recent dump, the major #Crypto assets now have negative 1Y Sharpe ratio. On a more positive note, the predictions have now turned seriously bullish.
After today's flush, for the first time in some weeks, I'm starting to see positive signals for the major cryptocurrencies $BTC, $ETH, $SOL. Also, notably $PAXG seems to want go up in contrast to the $GLD ETF. But... FWIW, $PAXG seems to be a better indicator for the markets than $GLD itself. That's mostly because it has perps, which are also used for the prediction.
OK, but how significant is this effect?
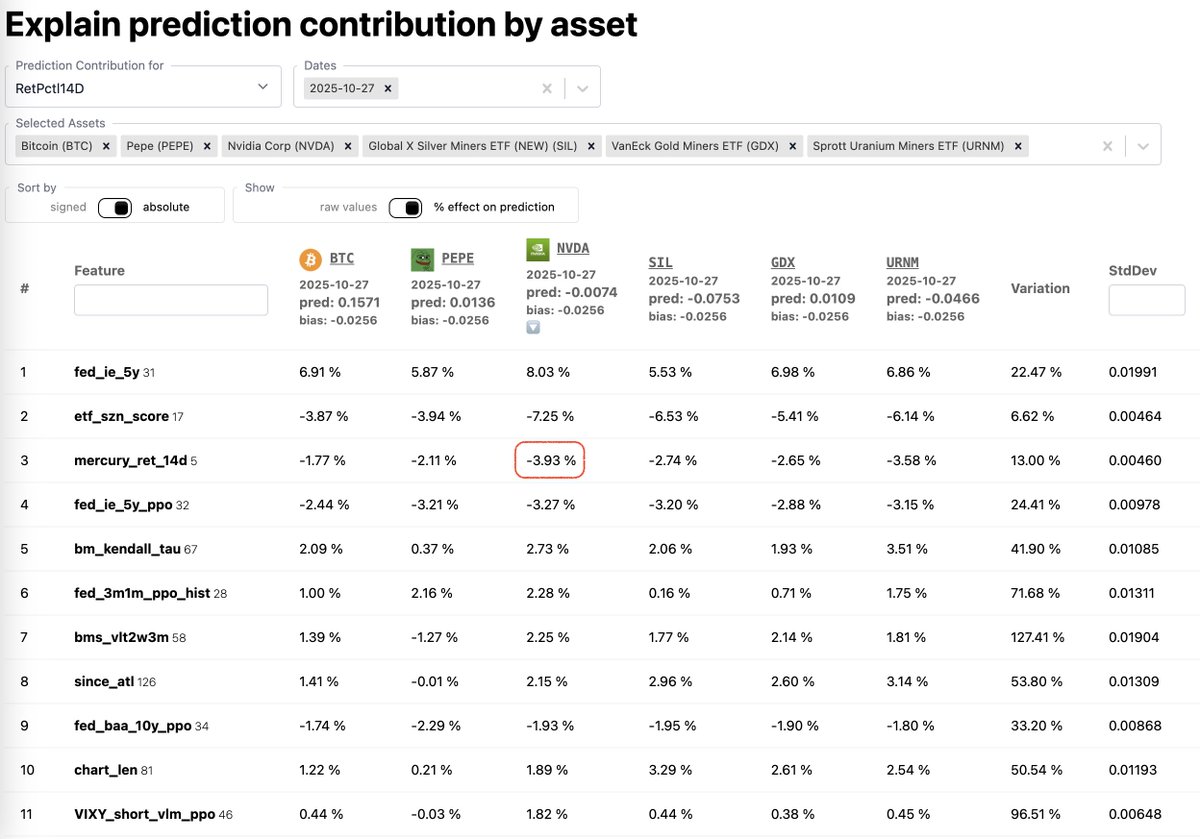
Pretty significant. Out of all the 150 parameters that go into the learning, retrograde mercury in in the third place by effect. Comparable in magnitude to the momentum of #FED inflation expectations for the next 5 years.
This started as a joke... but then it turned out to be real...
People seem to be using astrology to trade and by that they influence the markets. Hence, astrology influences the markets.
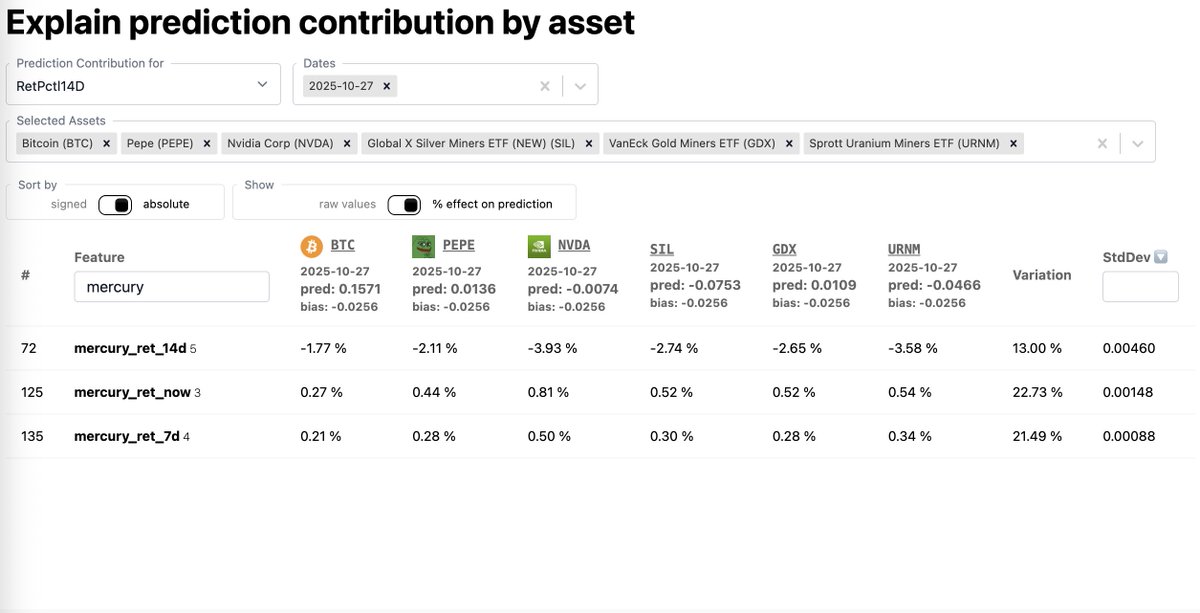
What we see here in the screenshot is the 14 day predictions issued by the algorithm yesterday and today. Can you see what's different? Yes, retrograde mercury starts in 14 days from today... So this parameter now has a negative effect on the prediction.
$BTC #astrology
OK, but does it mostly affect #crypto? Nope, it has even more pronounced effects on some #TradFi assets. In particular $NVDA seems to be one of the most affected by this.
$BTC, $PEPE, $NVDA, $SIL, $GDX, $URNM
Yesterday's $BTC candle was massive.
It noticeably changed the 1Y Rachev Ratio, this was the worst candle for the past year. Rachev ratio quantifies tail events, so in a way this was THE black swan of the year.
We can interpret it both ways. Bullish - this was the worst candle of the year so we are pumping now. Or, Bearish - This was the worst candle of the year, therefore trends have changed bearish.
https://t.co/1BWzlpUBD3
Implemented a prediction explanation page where predictions can be compared by date, asset and model feature.
Soon we will allow more people on our platform. Follow for more.
Been working on adding macroeconomic data to the learning parameters. Things like BAA10Y, T10Y2Y, T10Y3M. The first one of these seems to have very good predictive power for the overall market direction. At least the ML algorithm finds strong statistical correlation between it and the market moves over the next weeks. Latest move is quite a heavy dump since the beginning of Sep and around the middle of the month it broke the support it's been trying to break since June. So far Uptober seems... plausible?
https://t.co/IJb7BcB5u6
Over the past days I spent some time implementing the so called "risk adjusted measures" - Sharpe, Sortino and Omega ratios. Of the three, Omega turned out to be the "best" for what I am doing, so now it is the default color gradient in the chart (red to green). Here is a good article on Omega ratio: https://t.co/J6PVULV6Og
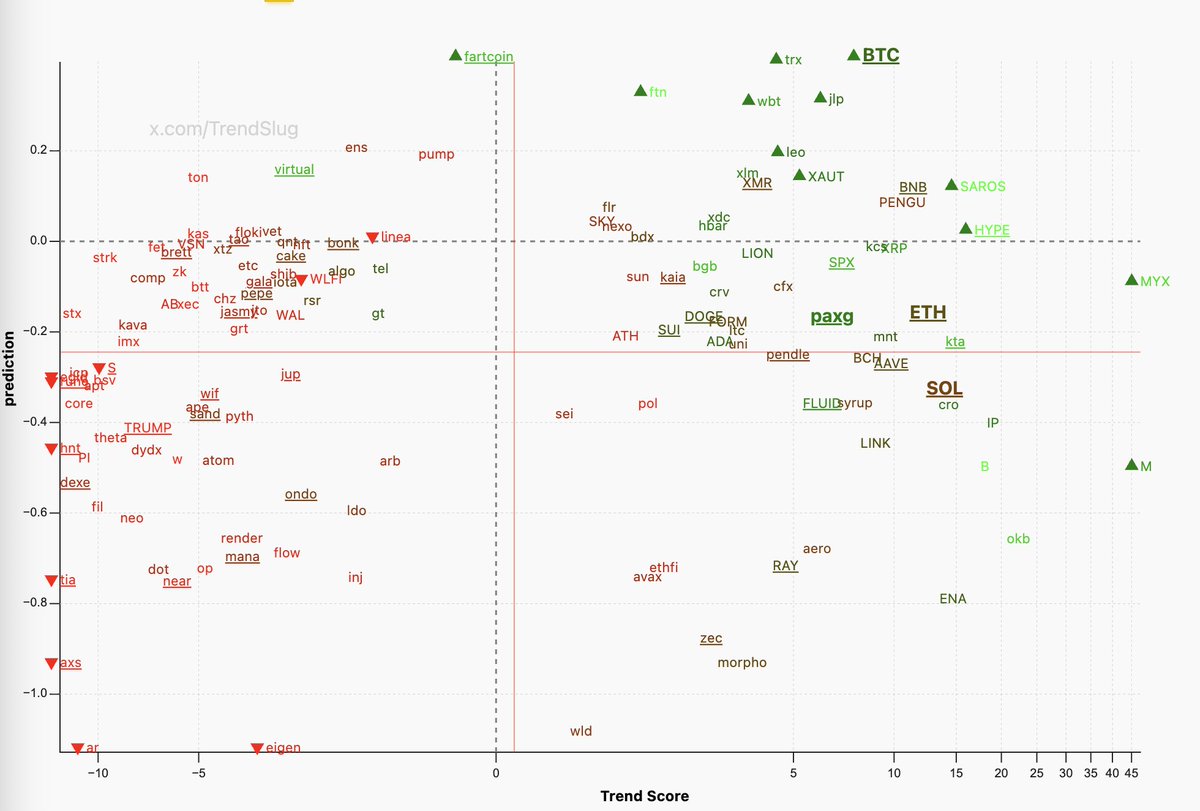
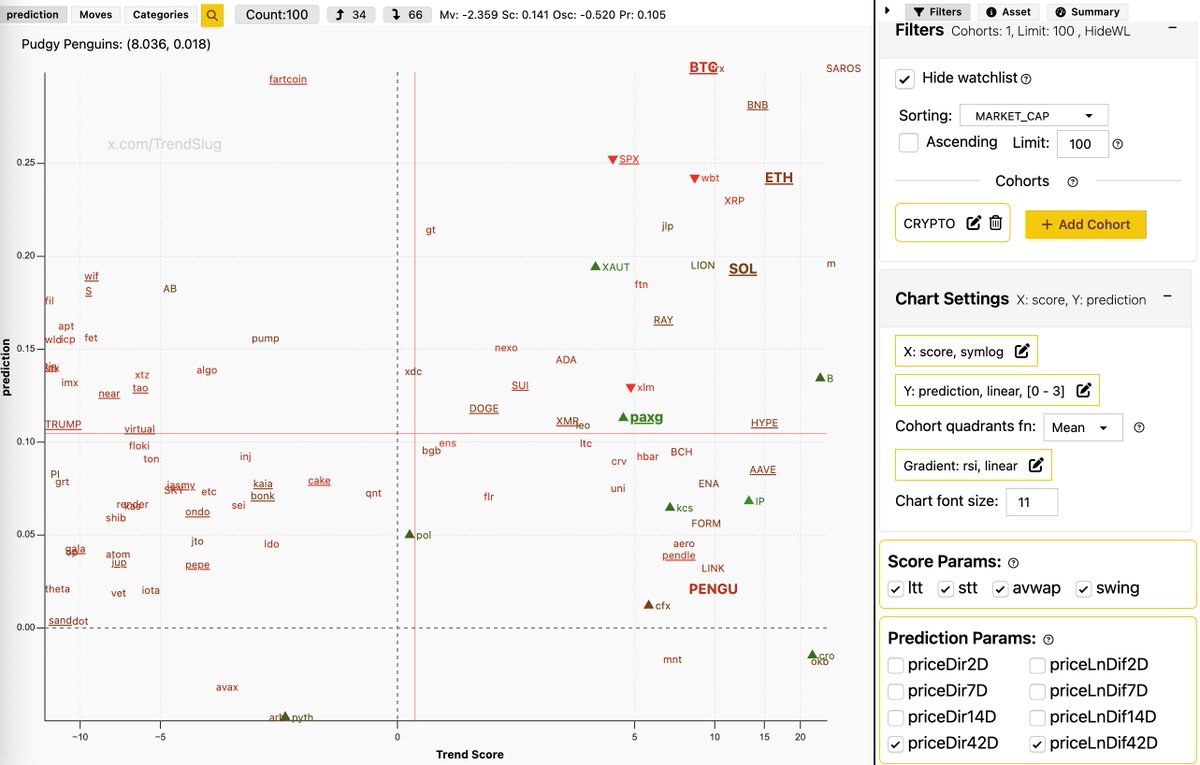
On top I implemented the so called "Pareto Frontier" (links in bottom) in three dimensions: trend score, prediction and omega ratio, so now they are displayed as upwards/downwards (for the downside Pareto front) in the chart and it helps noticing some interesting assets which might get lost among the others.
So here is a comparison of some major assets (both crypto and TradFi) employing these principles
Yes, $PUMP looks interesting for longing here... and yes $CRCL is a bit scary. Wonder what it tells us about the state of the crypto market.
https://t.co/zL2YQzPxir
https://t.co/gQcPzthYAj