Read this blog post about a recent project we supported: https://t.co/yG3i7kk3zW Benito-Vessels talks about her "Missing Link" project and the StoryMap Collection she used to share her research. See "The Missing Link" Collection here! https://t.co/sLZUwqZXt5
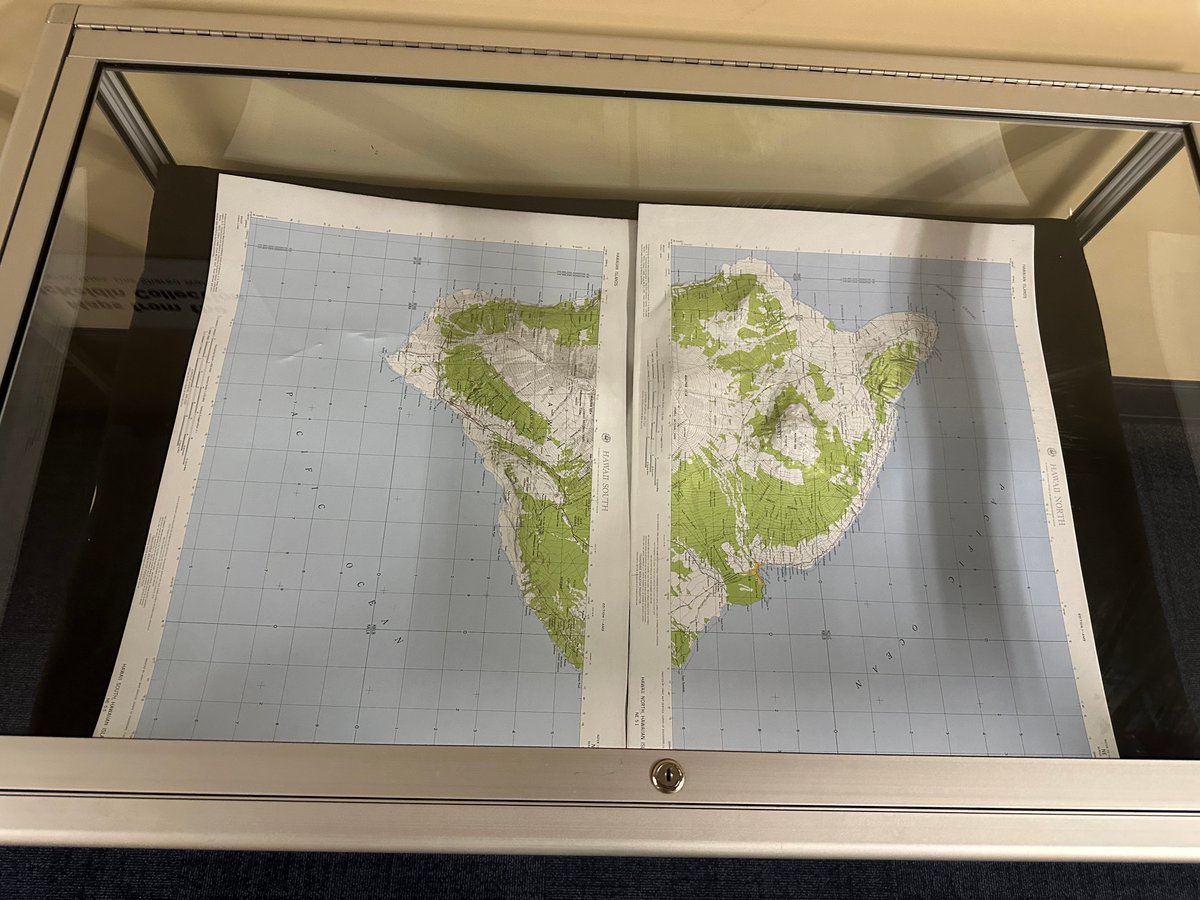
The AR Sandbox is an interactive educational technology that allows users to model 3D topographic features in real time on the sand’s surface. Tomorrow, experience this groundbreaking technology for yourself from 12:30 to 1 in the Makerspace Lab (STEM Library).
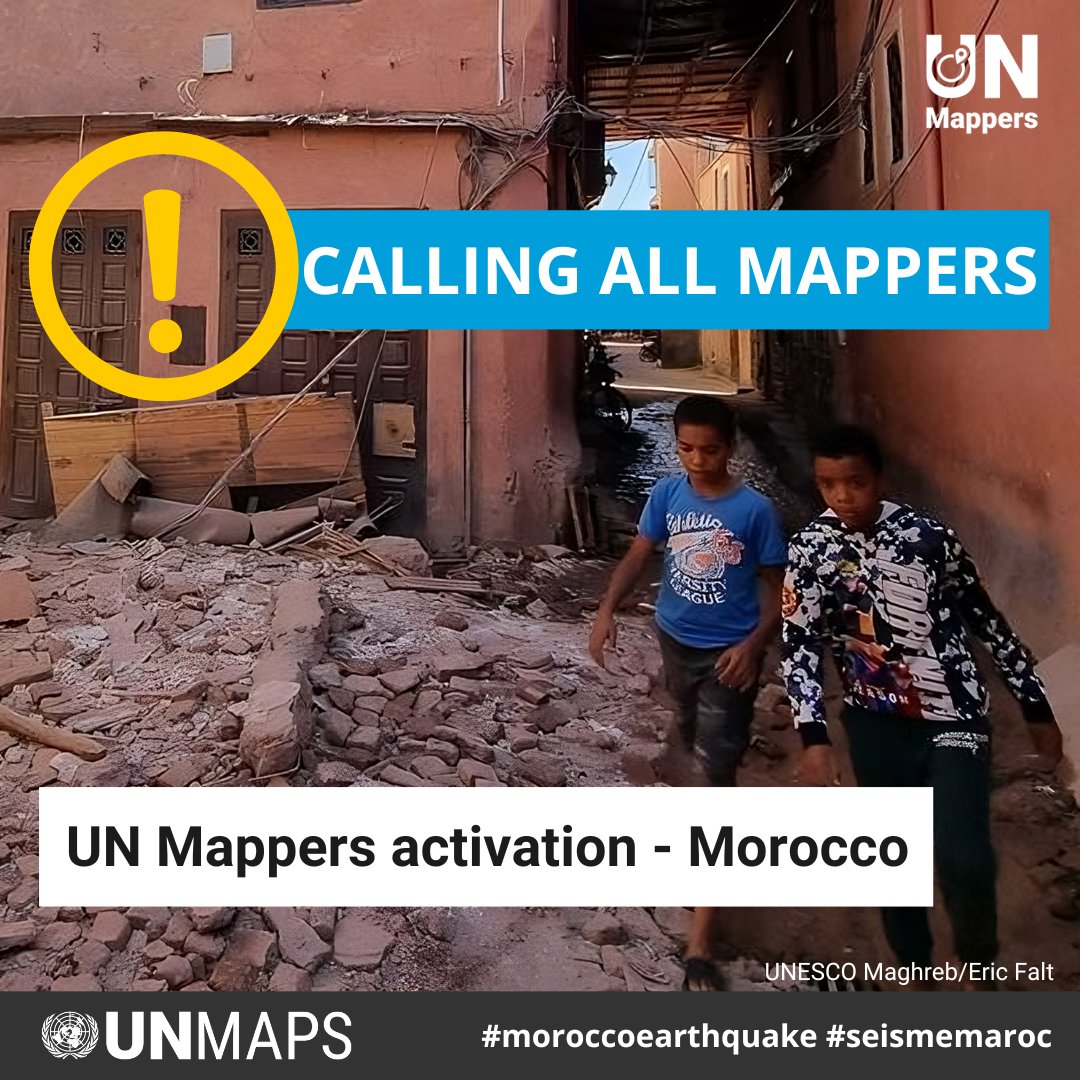
📢 UN Mappers activation!
🇲🇦Your mapping skills can save lives. Give your contribution in the aftermath of the earthquake that hit #Morocco ➡️ https://t.co/jazEJKGWRl
Don’t forget to add #UNMappers in your changeset comment.
#moroccoearthquake#seismemaroc@gischatbot
This #VizOfTheDay by @YoungDoesSciViz explores bacterial pathways involving the compound pyruvate. Pyruvate is the end product of glycolysis, the process by which the body breaks down glucose. https://t.co/xDQPrNtQD3
Maps are not just lines on paper, they are windows to history, culture, and the world's mysteries. Join us at the McKeldin Library East Wing Hallway (4th Floor) for a captivating Map Exhibition. You can also view our Map Exhibition online via storymap. @UMDLibraries@UMDResearch
Exciting news! Our center recently published a storymap via ArcGIS StoryMaps, spotlighting the remarkable collection of print maps/atlases in McKeldin Library at the University of Maryland Libraries College Park. Dive into the journey! @UMDLibraries#esri
https://t.co/7RJxN0qu3F
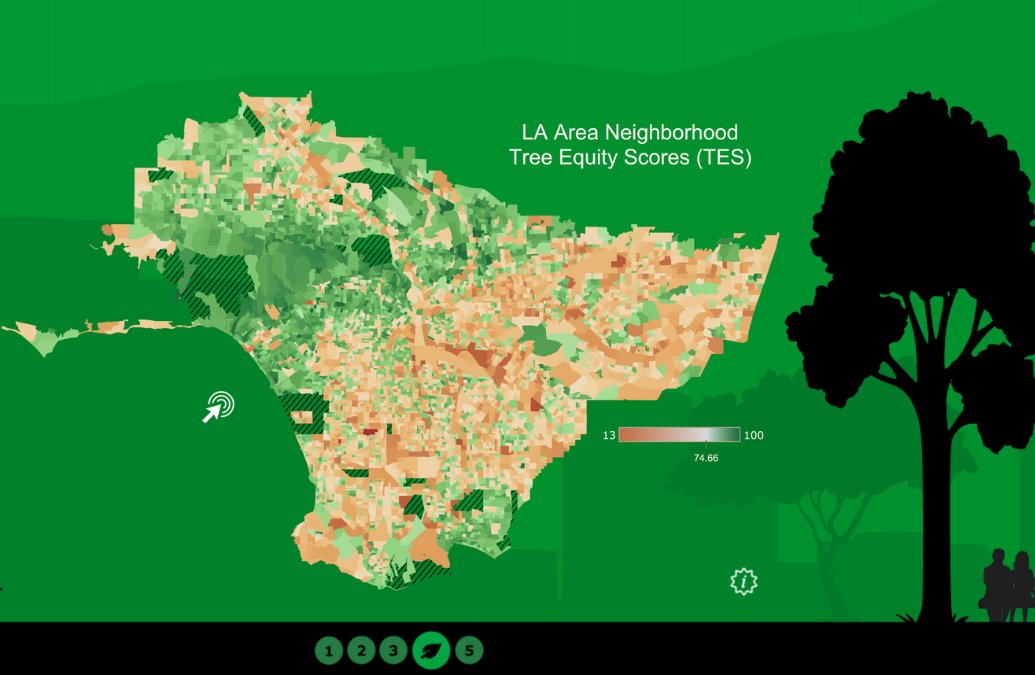
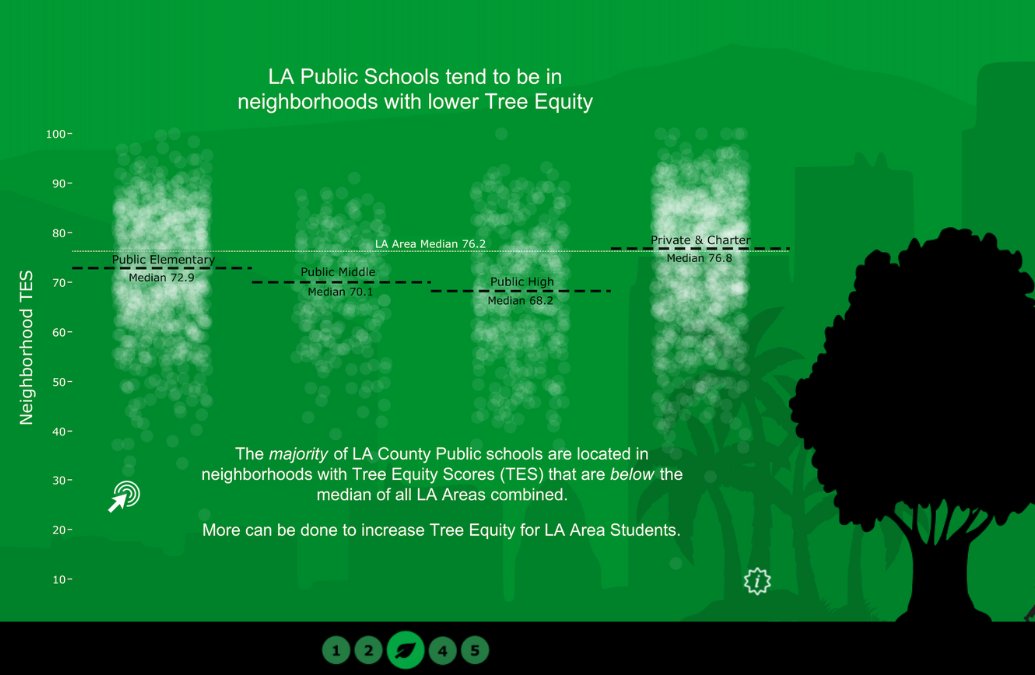
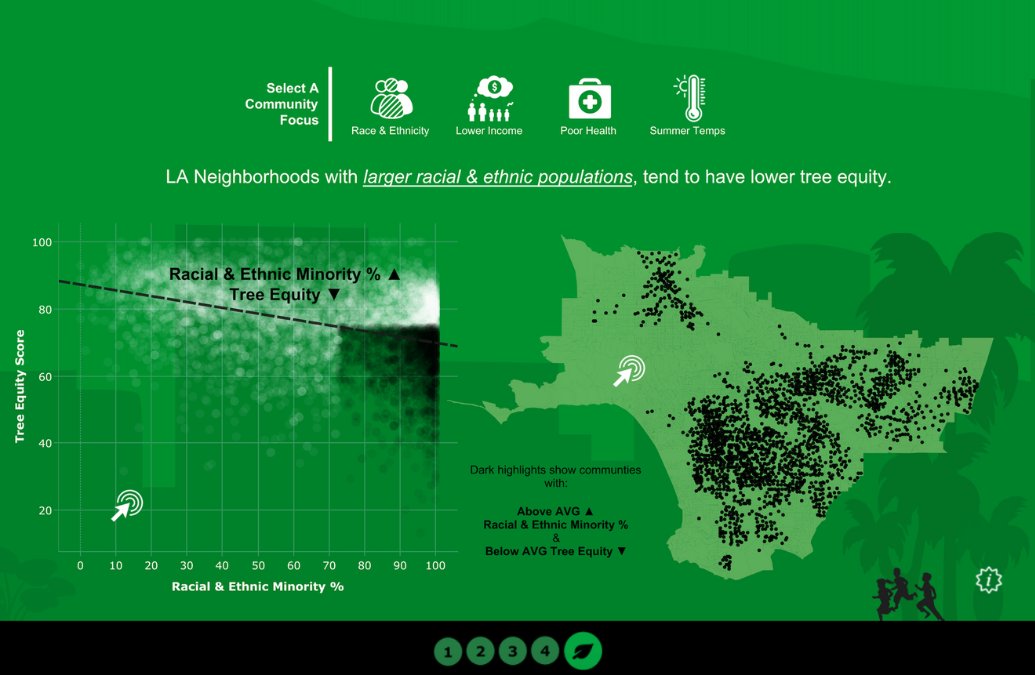
This #VizOfTheDay is a collaboration between @_dan_shepherd_ and @professorkao. It explores tree locations in Los Angeles and emphasizes their importance in children's lives, schools, and communities. https://t.co/MtE6D3ij1R
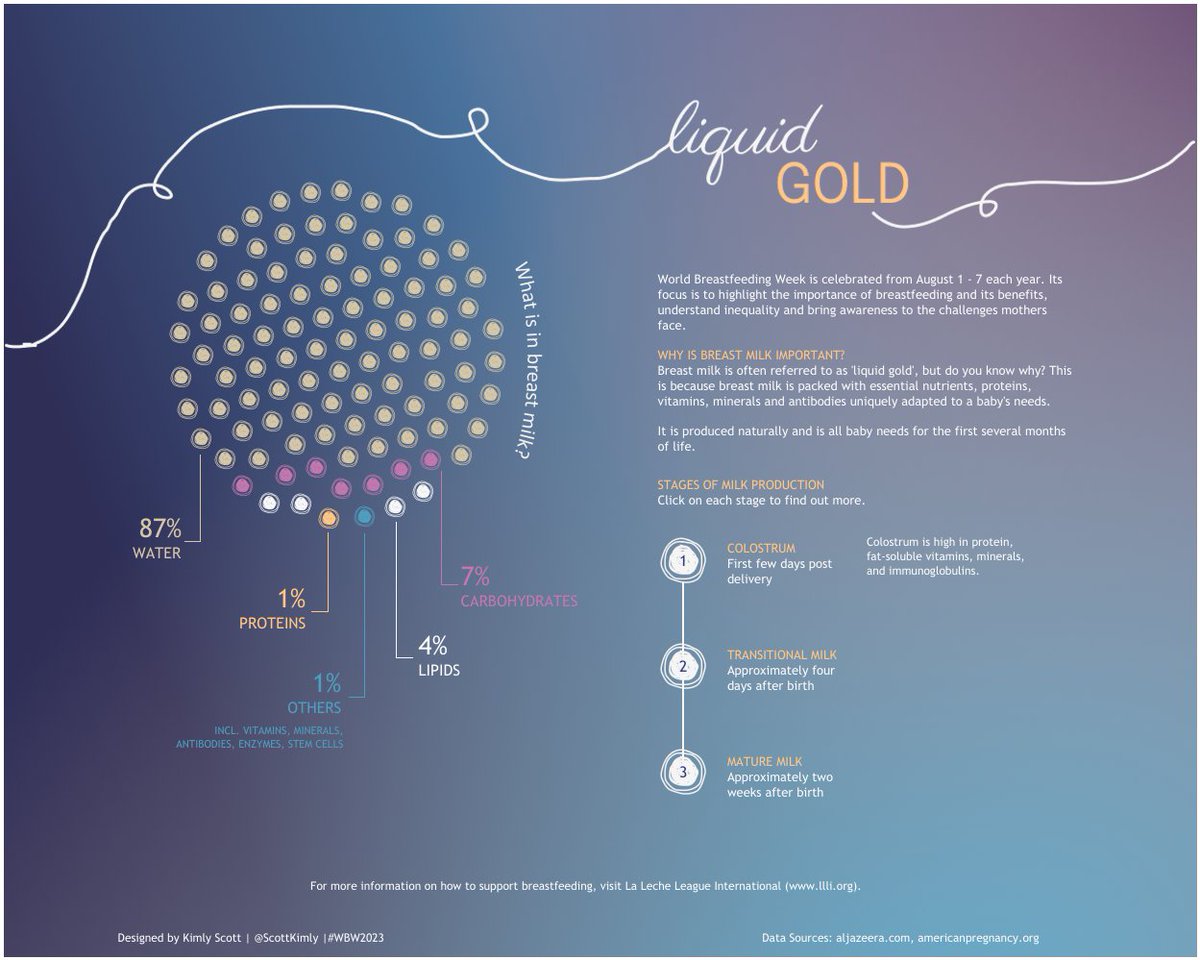
In celebration of World Breastfeeding Week, held annually from August 1 to 7, @ScottKimly visualizes in this #VizOfTheDay the composition of breast milk—also known as liquid gold. https://t.co/FnuVMogbCU
This #VizOfTheDay by @ItsMehras—a collaboration between community-led projects Back 2 Viz Basics (#B2VB) and #EduVizzers—visualizes the New York City SAT College Board results data using a scatter plot chart. https://t.co/kcjLMugLBu
The #QGISOpenDay scheduled for July 28, 2023, is rapidly filling up with captivating sessions. If you're interested in presenting a session, please get in touch with @amzenviro or simply add yourself to the wiki page at https://t.co/esxSOEJ9Cx.
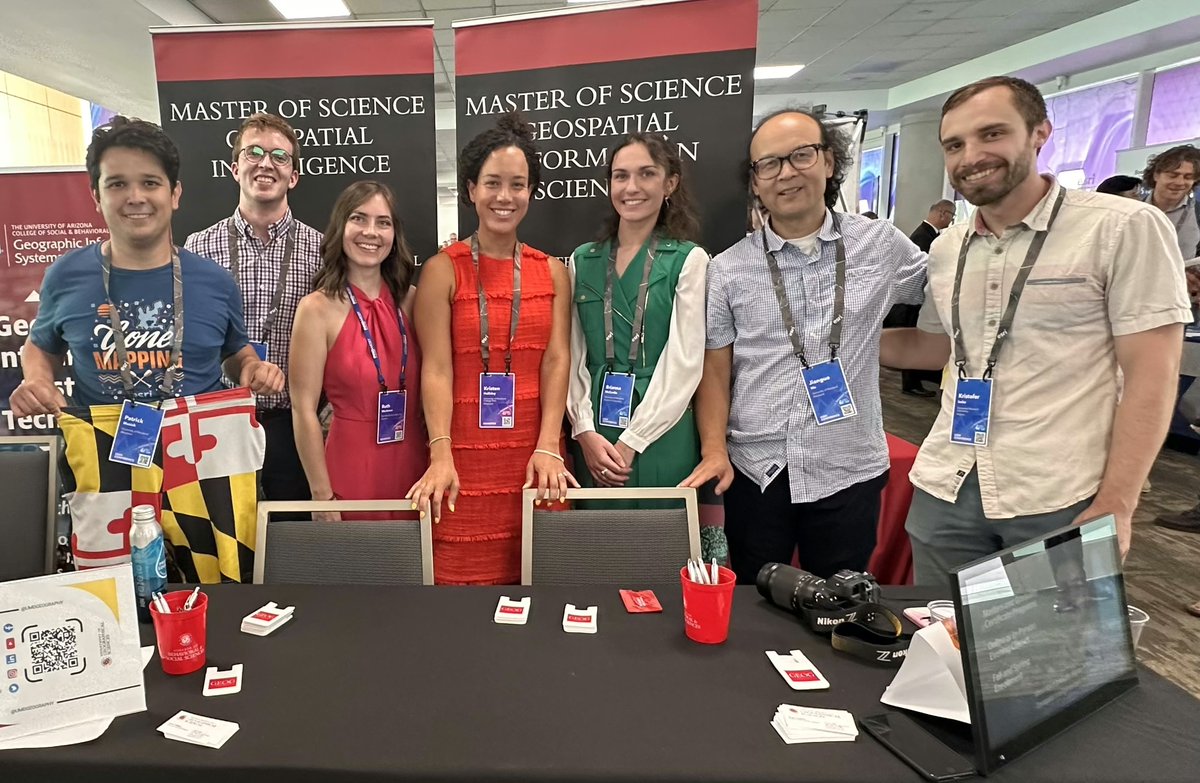
Did you attend #EsriUC2023? If not, here's our recap:
🏆 @UofMaryland received a Special Achievement in GIS Award
🎓 GEOG alums led sessions showcasing their work
🛰️ 100s attendees learned about our MS programs
https://t.co/zKYDoxzIy5
Matthew McLaughlin, from the Department of Arts at
@umd_arhu, has been utilizing maps in McKeldin Library (@UMDLibraries). Learn more about his research work and how he incorporates maps into it!
https://t.co/cDZ27KeDf4
New on the BTAA GIN blog: Interview with @UofMaryland senior lecturer and mixed-media artist Matthew T. (Matt) McLaughlin, who incorporates maps and concepts of mapping into his art.
https://t.co/czKmnXnw9a
Heavy rains have caused severe flooding in the northeastern United States. We need YOUR help to map affected areas in Vermont for first responders & relief agencies. Help us map buildings, roads, and waterways on the OSM US Tasking Manager: https://t.co/3ubQQvrQov
The new National Geographic MapMaker has some unique features for teaching. Use the weather simulation tool in 3D to aide understanding and reduce cognitive load for flooding case studies. Try it for yourself at https://t.co/92wRmaZknk
#EsriUC2023#geographyteacher
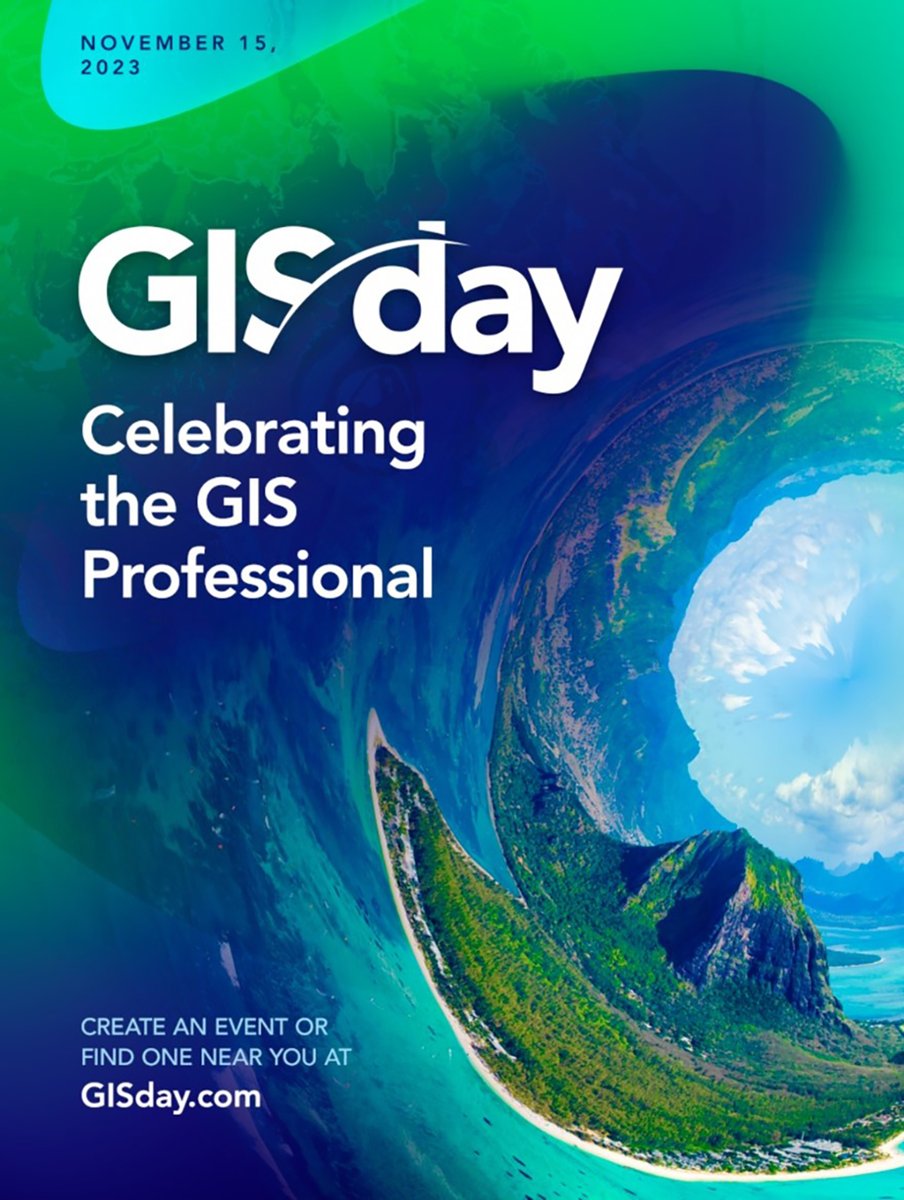
The countdown begins! ⏰ Join the worldwide celebration of @gisday on November 15. 🌎 Here are three ways to get involved and share your passion for #GIS. https://t.co/JXaRzLHYPb
#GISday#EsriUC2023