@capnek123 Here´s an overview of total insider+institutional holdings for #uranium miners, showing overall very high ownership. More tables via link in bio.
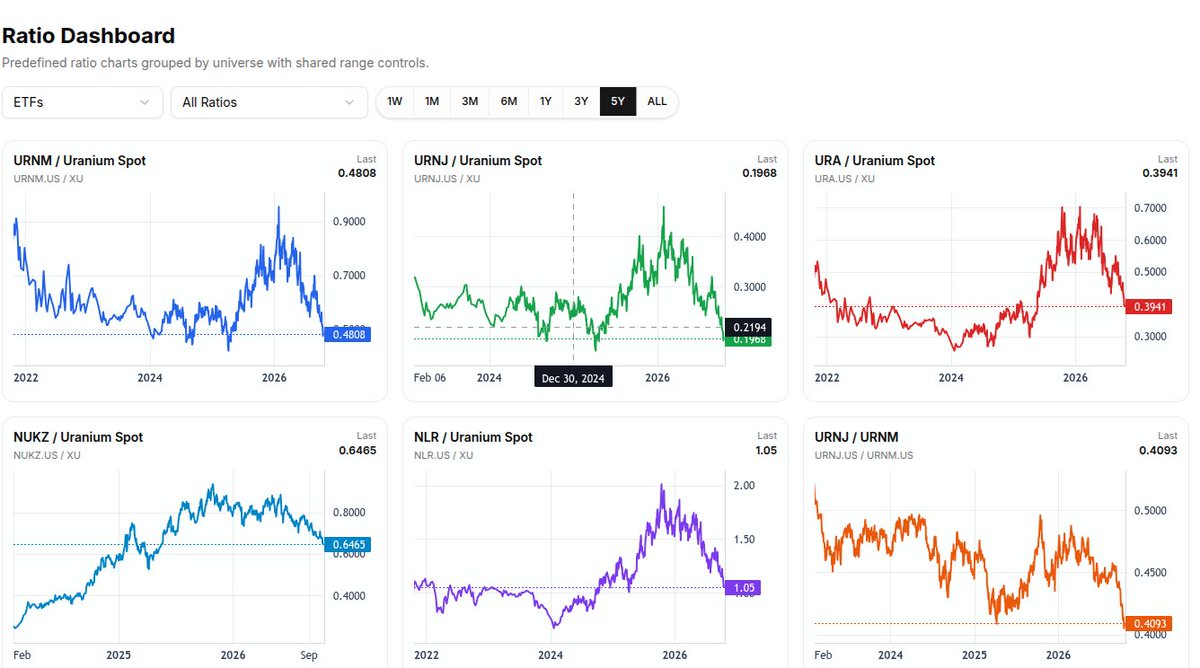
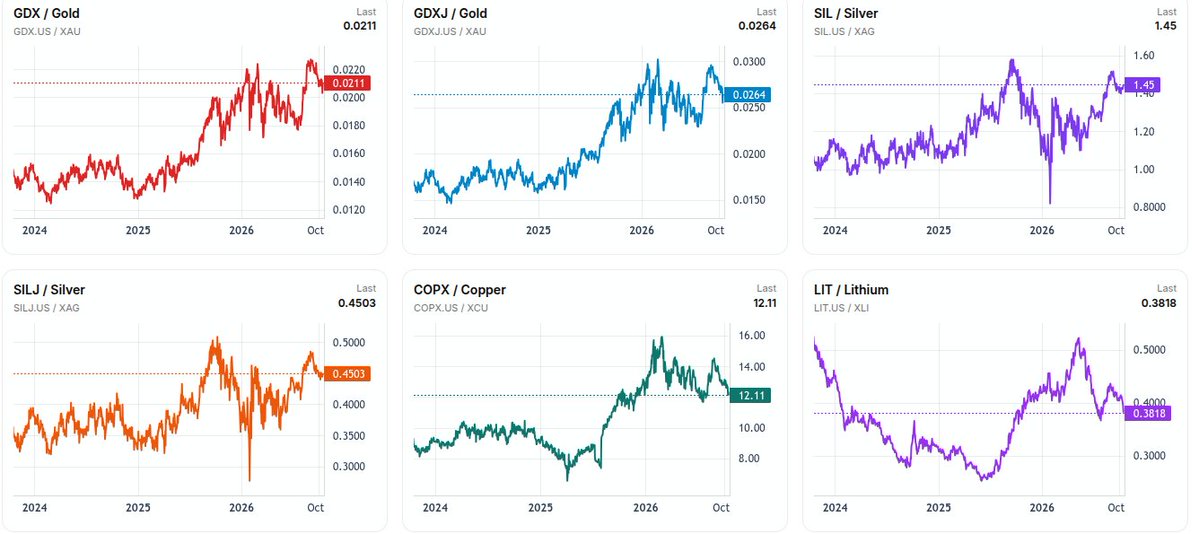
While physical #uranium has moved largely in line with other #metals the last two years and the ratios of miners to physical of most metals have risen steadily, the uranium miner to physical ratios have reached 5Y lows. More charts via link in bio.
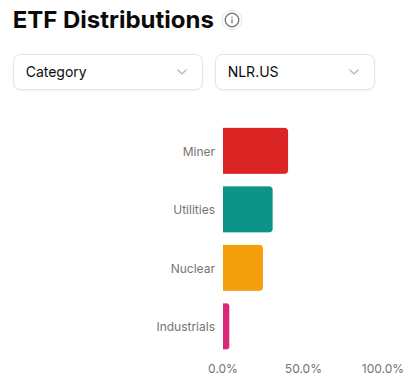
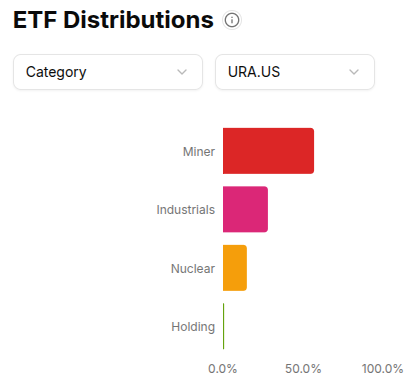
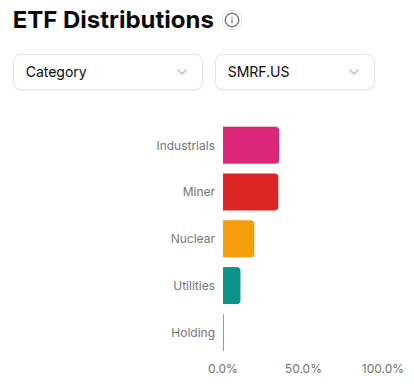
Just to be sure what you are holding with these ETFs here´s a short overview: $URA has a fairly significant allocation to Industrials (mainly engineering conglomerates), $NLR has perhaps a more overall #nuclear focus in that they hold less industrials but a significant portion of Nuclear Utilities and 25% in #smr developers (the highest of all ETFs). $SMRF has industrials as their highest allocation. More details via the link in bio.
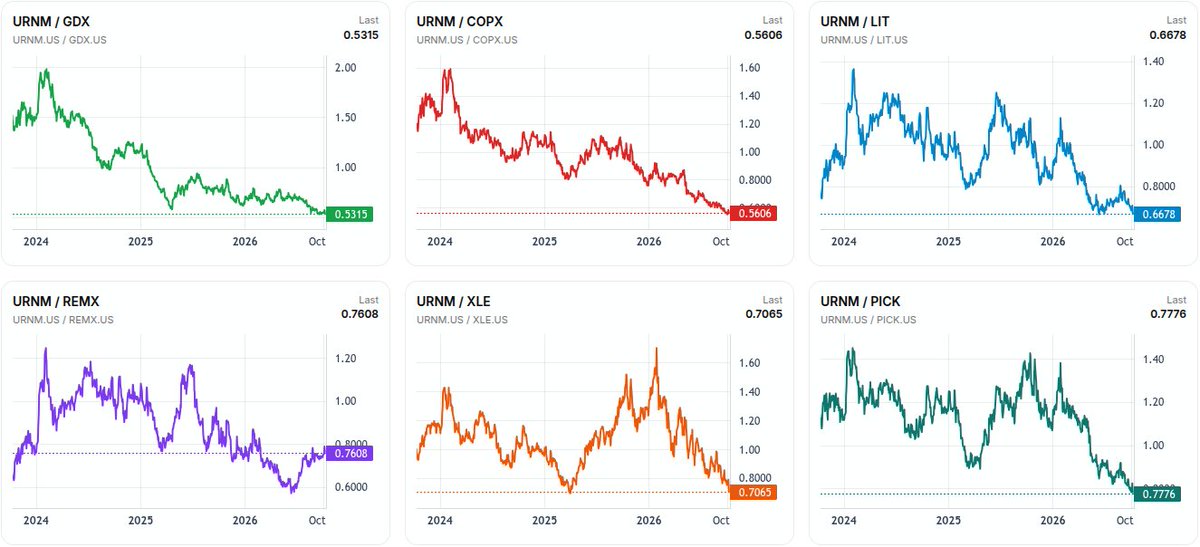
3Y ratio charts of #uranium ETFs Vs U-Spot and benchmark commodity ETFs. Also benchmark commodity ETFs Vs their respective physical commodity. Despite this week´s selloff in all commodity ETFs, the other ETF ratios are not too far off their 3Y highs. Only uranium is at it´s multi-year lows. Bottom in?
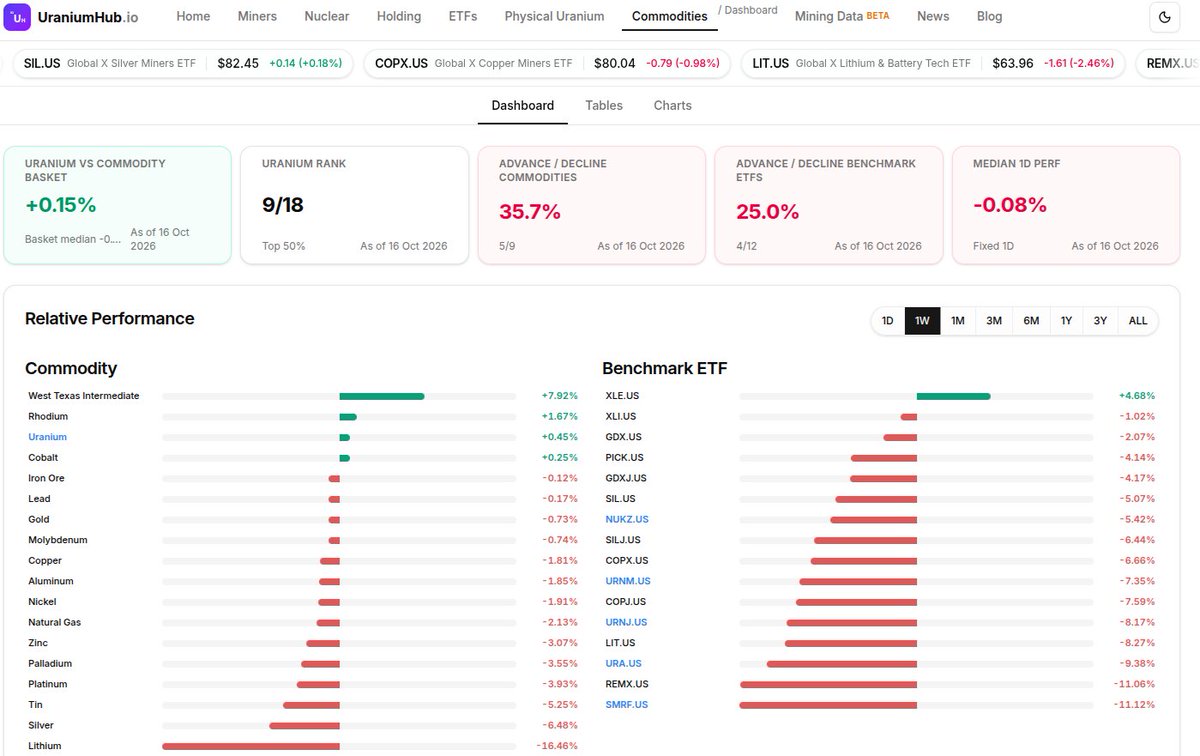
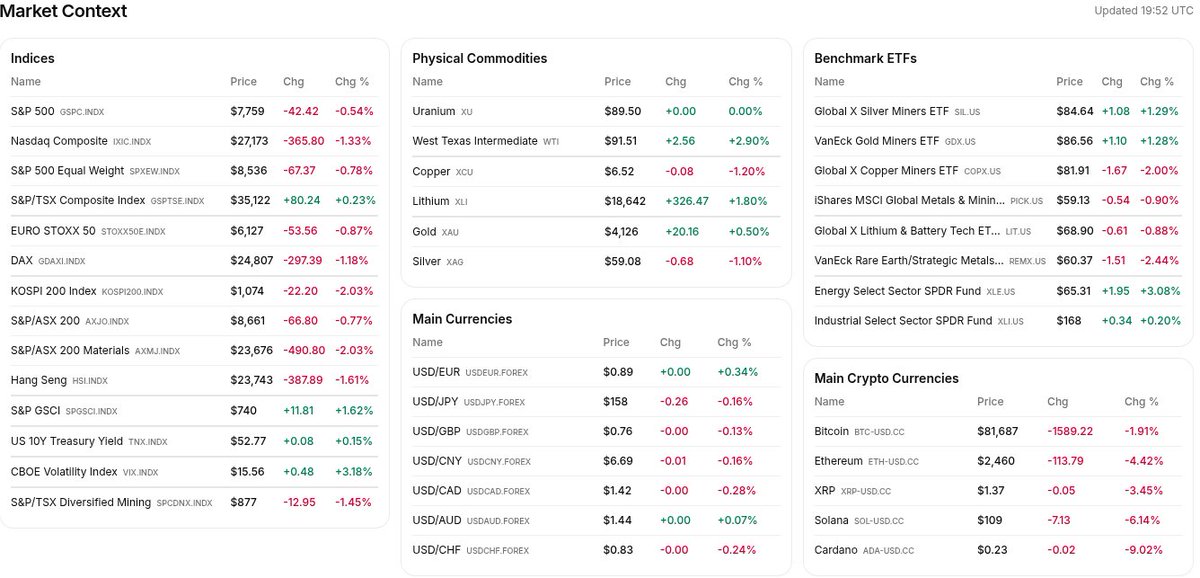
Commodities and their ETFs on the daily and weekly timeframes. The physicals didn´t do too badly, ETFs not a pretty sight. #uranium ETFs holding the middle ground.
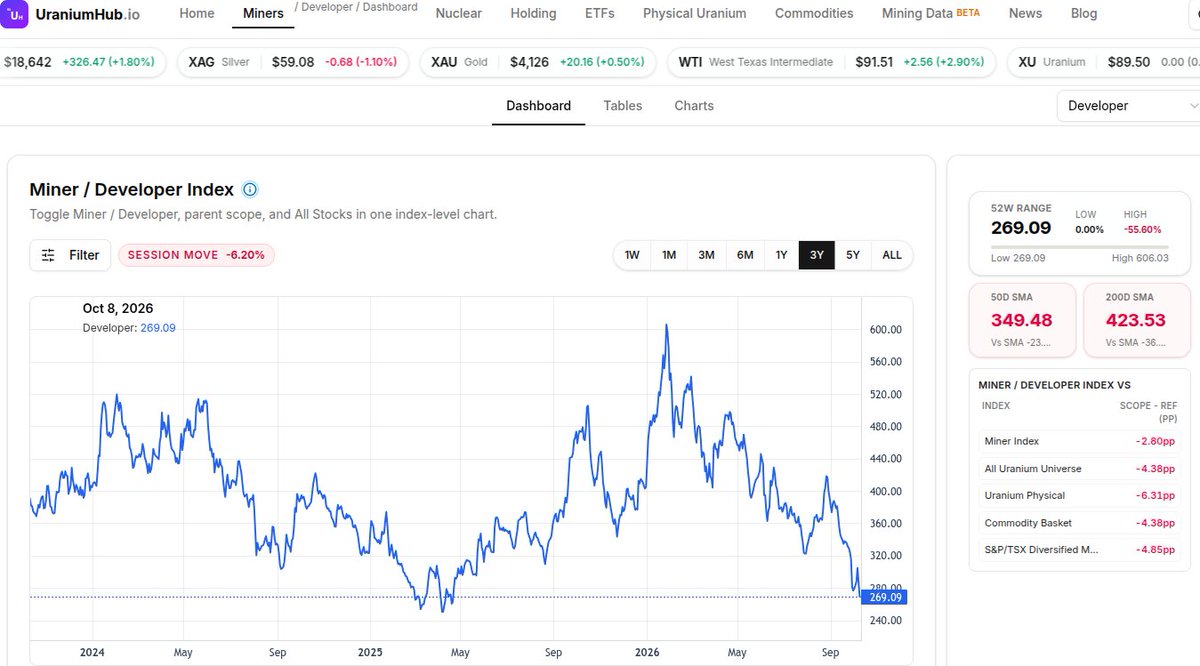
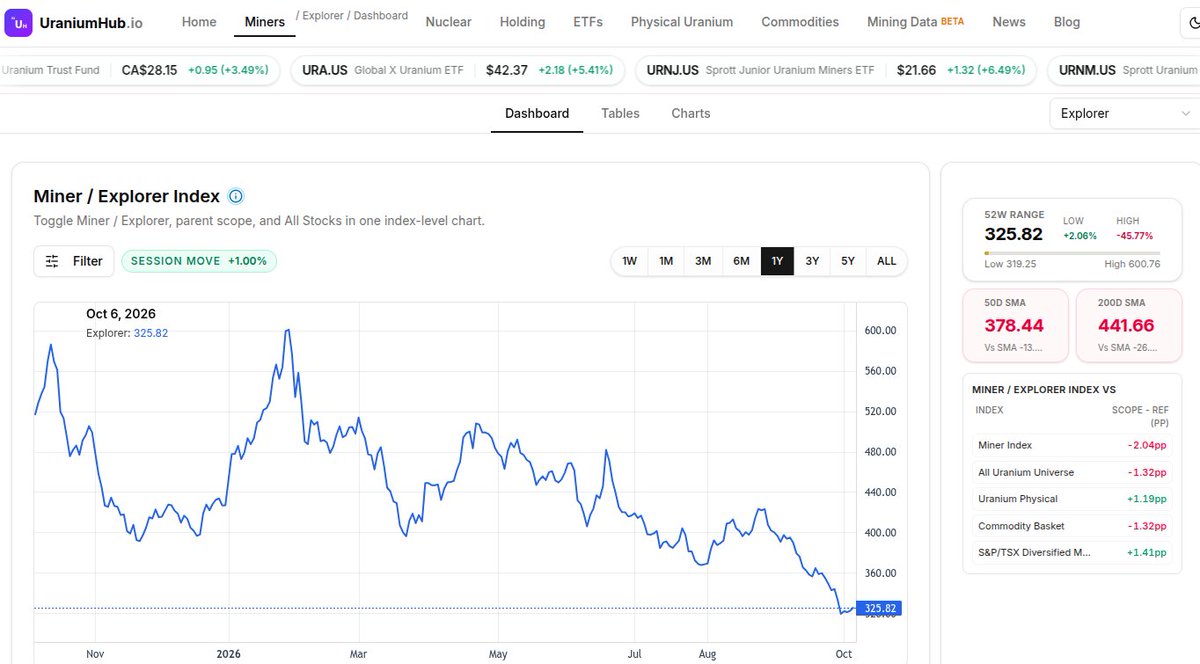
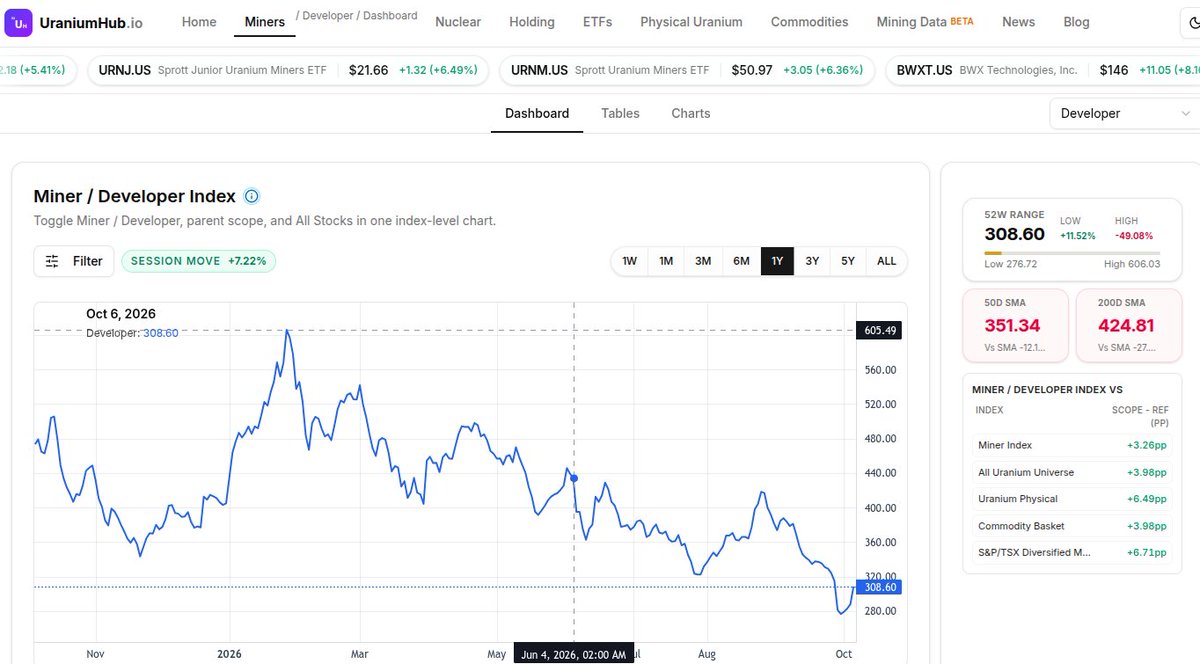
Equal-weight #uranium developer and explorer indices at levels which marked the lows over the last 5 years. In "normal" times this would be a good support level.
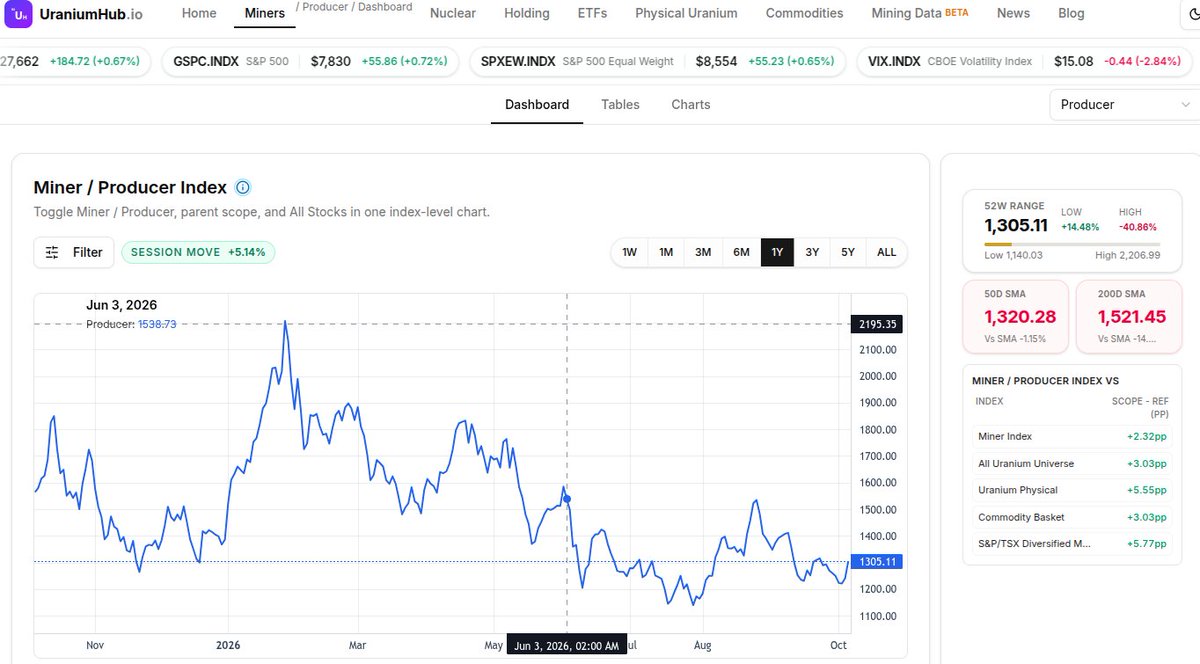
Markets going risk-off causing a "trickling down" in a torrent to commodities and #uranium miners. Producers leading the downturn, explorers faring slightly better.
@capnek123 It´s much worse than that, strip out producers and only viewing developers and explorers takes us back to 2022 levels using our equal-weight indices. On the bright side, we are at long-term support levels, downside surely very limited now. #uranium
@UDiamondBalls Underperformance of #uranium Miners visible on our 3Y ratio charts. Also the ratio charts of Uranium ETFs to the benchmark ETFs showing big underperformance, with the possible exception of Rare Earths REMX.
Despite the recent carnage, #uranium equal-weight producer index still well off the lows of last year´s tarif capers, developers and producers nearly there.
With today´s big moves our equal-weight US/CA #uranium producers index has risen 14% off the 52W low from end July. Developers made a lower low last week and are now up 11% from there. Explorers only up 2% from last week´s 52W low.
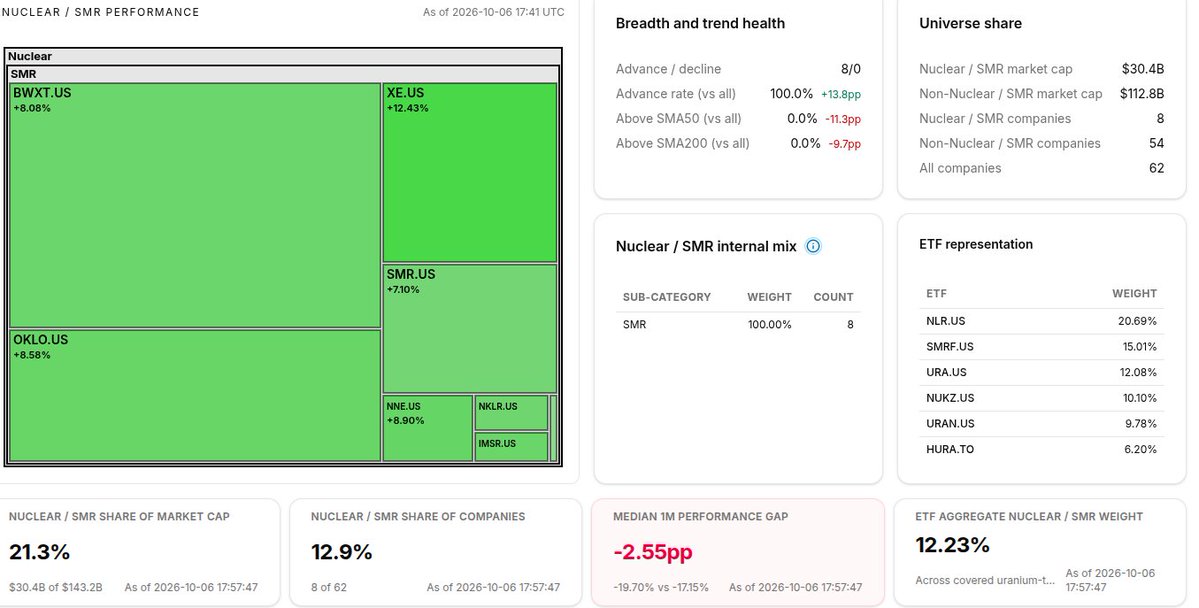
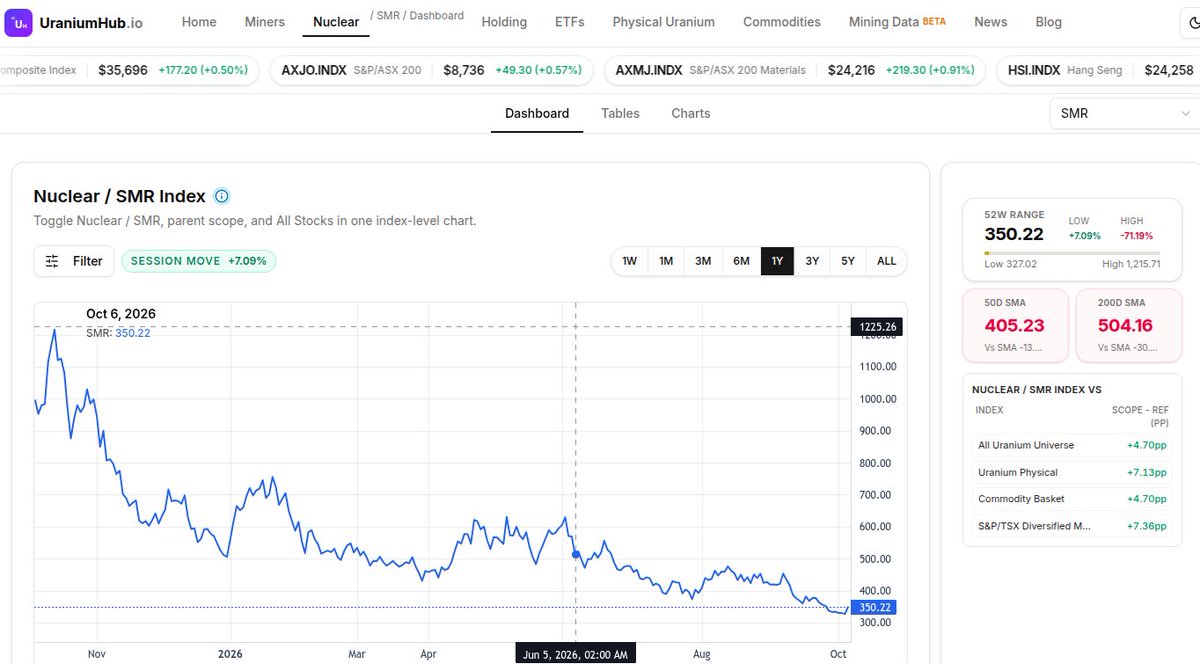
Just for fun, equal-weight #smr stocks up 7% from their recent low - and that was a low to behold.
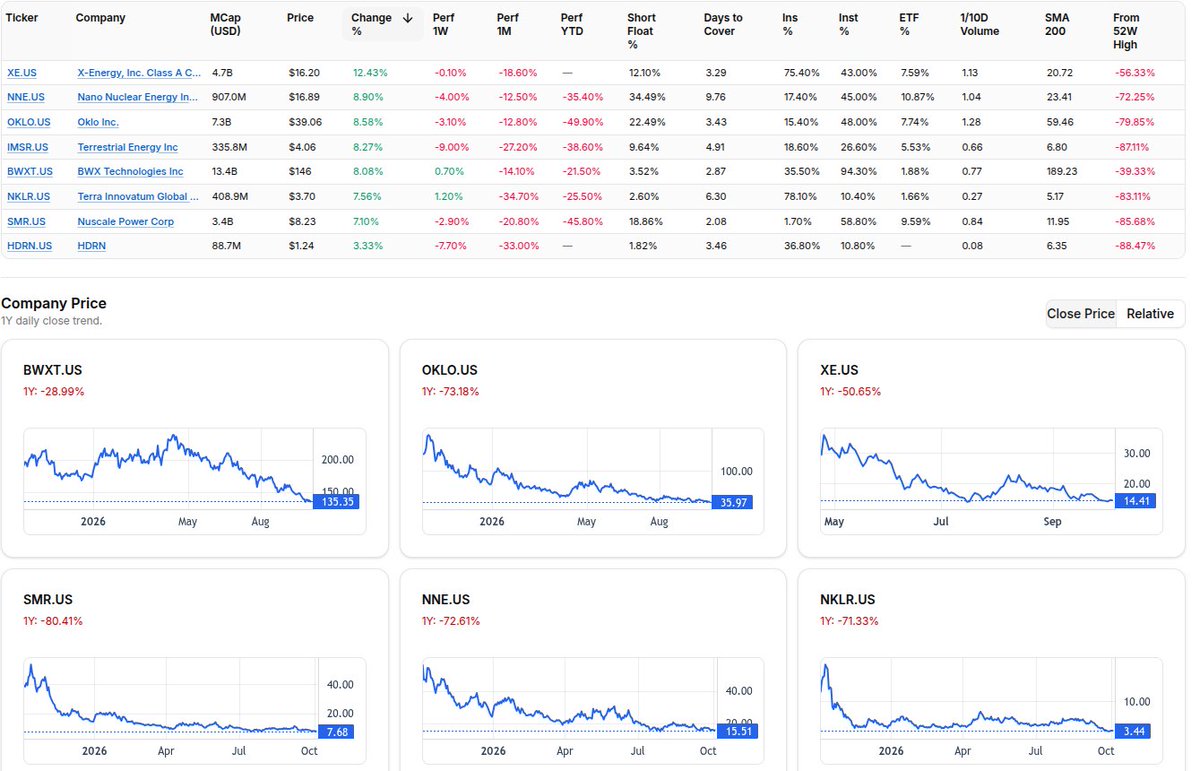
Huge up move by the #smr stocks also, led by $XE, $OKLO, $NNE and co. Not surprising as they were down between 39% and 88% from their 52W highs. Still high short floats to work through as well.
#uranium
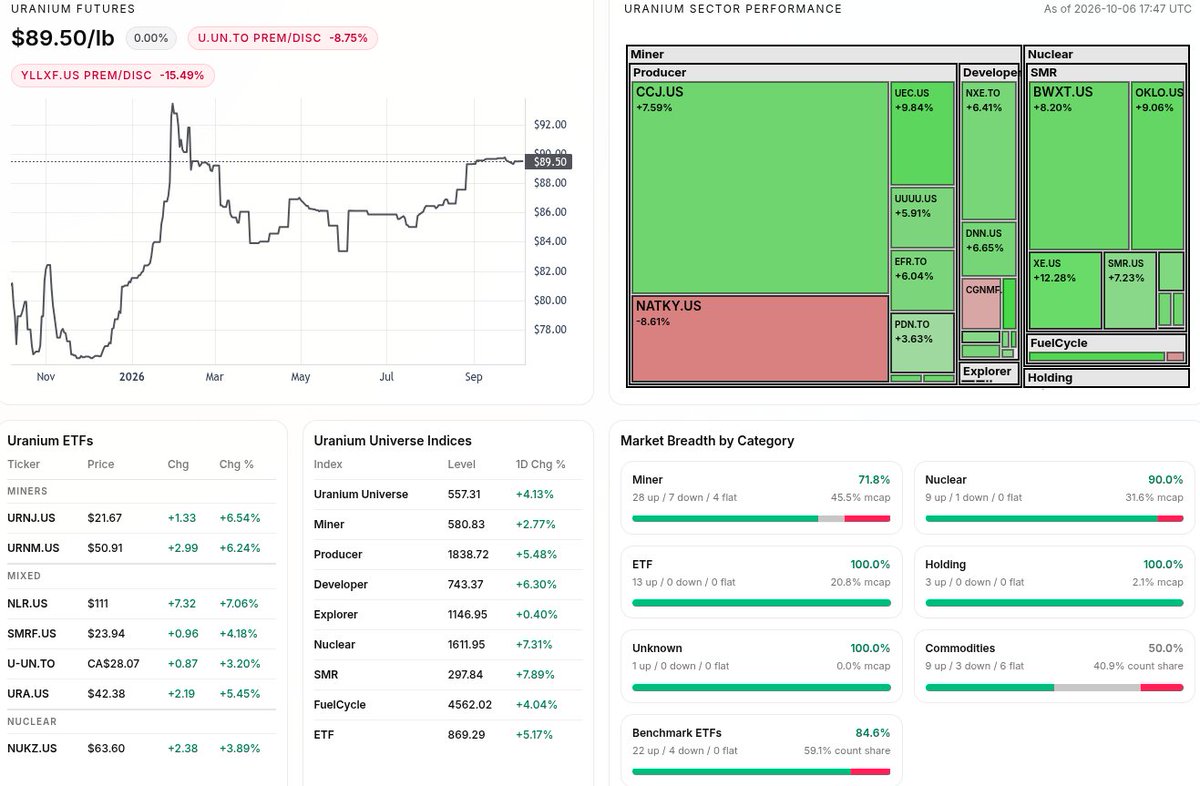
Today´s surge by #uranium stocks occurring primarily in producers and developers, explorers are more subdued, as shown by our own sub-indices. ETFs are of course strongly weighted towards the large caps so also moving in lockstep. Uranium ETFs crushing it in the commodity table.
Just doing some fantasy calcs to assess Supercom´s potential revenues in Europe. Taking Sweden as the gold standard for EM rollout, where they are heading for $10m revenues per year ($75m over 7 years?) on a population of 10m. Scaling this up to their other contracted countries would give potentially $139m p.a. in Europe alone. Looks like EM is becoming a gamechanger in handling crime in Europe, even woke perpetrator-friendly Germany announced plans last week to clamp all potential islamist sympathizers. Mood amongst the public towards crime is flipping, leaving even wokist governments with no choice but to harden their stance on crime if they want to stem the shift to the political right.
The list below outlines the European countries where SuperCom currently maintains public safety or electronic monitoring contracts, along with their respective population figures:
Germany: 84,000,000
Romania: 19,000,000
Sweden: 10,500,000
Denmark: 5,900,000
Finland: 5,600,000
Norway: 5,500,000
Croatia: 3,800,000
Lithuania: 2,800,000
Latvia: 1,900,000 [1, 2, 3]
Total Sum
The combined total population of these contracted European nations is 139,000,000 people.