Good morning.
An issue frequently discussed here—higher bond yields—has now decisively evolved into a global phenomenon.
US yield dynamics, driven largely by massive corporate and government issuance calendars, are increasingly fueling cross-border spillovers, also pushing borrowing costs in other economies to multi-decade highs.
(Bloomberg chart below on the US 30-year government bond yield.)
#economy #markets #bonds
Japan is the canary. Nobody is listening.
For thirty years Japan ran the largest monetary experiment in human history. Zero rates. Yield curve control. A central bank that ended up owning roughly half its own government bond market. The theory was that a sovereign borrowing in its own currency faces no real constraint. For three decades the theory held, and every trader who bet against it got carried out on a stretcher. They called it the widowmaker.
The widowmaker is collecting now.
Debt above 200% of GDP. The 10 year JGB touched 2.91% last week, the highest in thirty years. The policy rate sits at 1%, a level last seen in 1995. Debt servicing in the fiscal 2026 budget hit 31.3 trillion yen, roughly a quarter of the entire national budget, and the Ministry of Finance now assumes a 3% bond rate, the highest assumption since 1997. Social security and interest payments together consume close to 60% of all government spending.
Six of every ten yen Tokyo spends now goes to promises made in the past. The remaining four have to cover defense, education, infrastructure, and everything else a modern state is supposed to do.
The yen sits at 163, a 40 year low. Japan burned roughly 11.7 trillion yen defending it and bought a few weeks of relief. This is the trap they built for themselves. Hike enough to defend the currency and the interest bill detonates. Hold rates to protect the fiscal position and the currency keeps bleeding out. Japan imports 90% of its energy and 60% of its calories, so every tick of depreciation lands directly on the grocery bill.
Now the part almost nobody models correctly. Hyperinflation is a distraction. Four percent for fifteen years cuts purchasing power roughly in half, and it arrives so slowly that no single year ever registers as a crisis. There are no wheelbarrow photographs from a 4% decade. There is a retiree in 2041 who did everything right and is poor anyway.
The Japanese saver pays for this twice. Thirty years of zero rates already moved wealth quietly out of household balance sheets and into the state's. Now the debt those zero rates financed gets inflated away in real terms while consumption taxes climb and benefits get quietly trimmed. A bond issued at 0.2% rolls at 3%, and the gap comes out of somebody's standard of living. Extraction, spread thin enough that nobody can point to the day it happened.
Now look west.
US publicly held debt is at 99% of GDP, the highest since 1946, and the CBO baseline puts it at 120% by 2036. Net interest runs from about 1 trillion this year to 2.1 trillion by 2036. The number that should keep you up: the primary deficit, excluding interest, actually declines over that window, from 2.6% of GDP to 2.1%. The entire deterioration is interest compounding on itself. CBO's own baseline has the average rate on the debt crossing above the growth rate around 2031, the threshold where the arithmetic stops correcting itself and starts feeding itself.
The 30 year is at its highest since 2007. The Fed just held with three members dissenting in favor of a hike. And Japan, sitting on 1.19 trillion of Treasuries as the largest foreign holder, sold nearly 30 billion in the first quarter alone. When domestic bonds pay 2.8% with no currency risk attached, Japanese insurers have no reason to own American paper. The most reliable marginal bidder in the world is packing up and going home.
Central planning dies slowly. It ends as a grinding transfer from everyone who saved to everyone who borrowed, administered by people who will call it stability the entire time it is happening.
Japan is fifteen years ahead of us on this road. Everything happening to them is a broadcast from our own future, running in real time, with the sound turned off.
More on the Yen:
Per the @FT: "The US Treasury intervened in yen exchange rates on Friday, marking the first time Tokyo and Washington joined forces to support the Japanese currency via outright purchases in nearly 30 years.
The Federal Reserve Bank of New York undertook the unusual move of conducting a sale of euros to buy yen on behalf of the Treasury, according to three people familiar with the matter."
#economy #markets #yen #japan #fx #currency
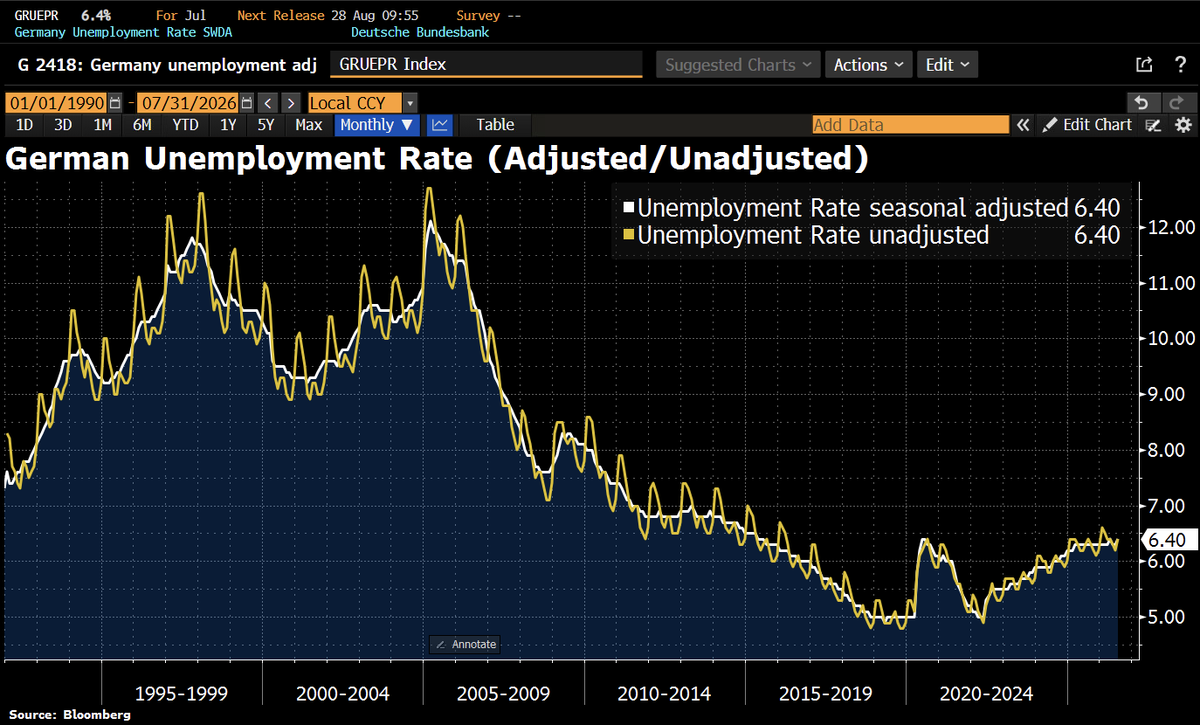
Good Morning from Germany, where the manufacturing downturn is now hitting the labor market. The seasonally adj jobless rate rose to 6.4% in July, above the 6.3% forecast and back at levels seen in the pandemic year 2020. Unemployment increased by 6,000.
Fed holds rates steady but 3 officials dissent favoring a hike (Hammack, Kashkari, and Logan). The statement offers nothing particularly new, and clearly there is a risk of a move in September. 2y yields drop, suggesting that there were indeed some decent-sized bets that the Fed would hike.
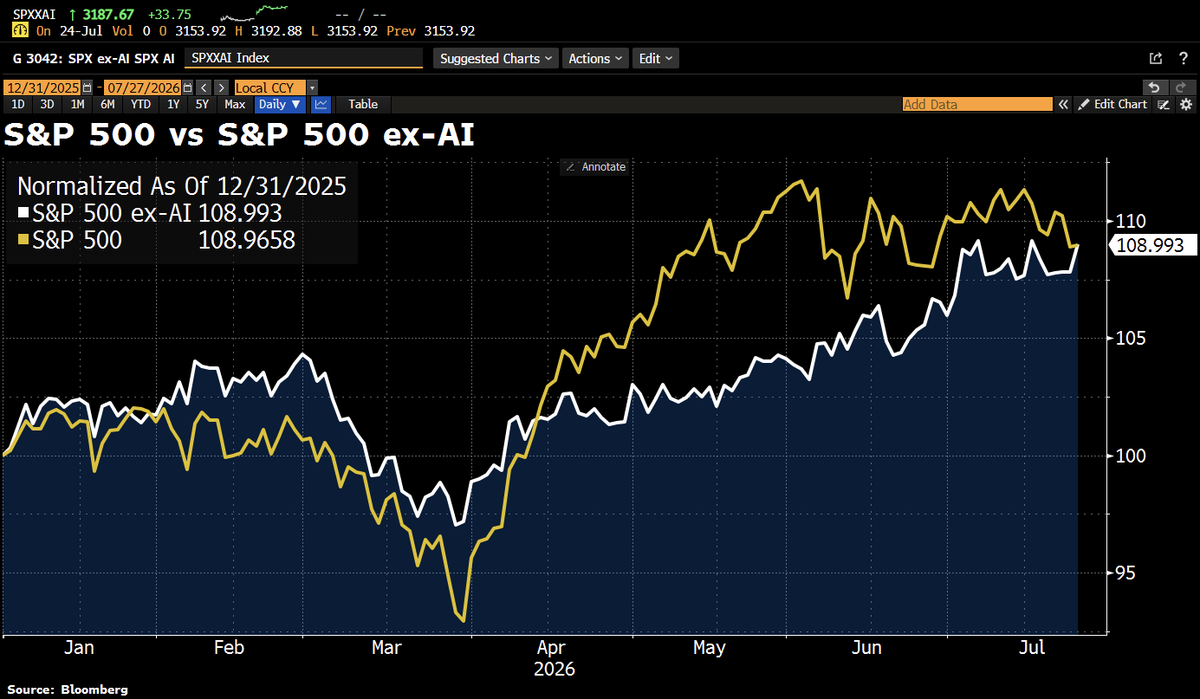
AI has stopped carrying the market. The S&P 500 ex-AI Index is now marginally outperforming the full index S&P 500 in 2026. The boom isn’t over, but as capex overwhelms cash flow, investors are finally asking the crucial question: Where are the returns?
CHART OF THE DAY: While most of the critical minerals talk in the US is about rare earths, something far more important is happening:
US aluminum all-in costs have surged to a record as traders/smelters demand huge physical premia on top of LME prices due to Trump’s tariffs.
From @TheEconomist:
"America’s surging stockmarket has been driven, most of all, by old investors.... Americans aged 70 and above now own 39% of all stocks and mutual funds (which mostly invest in equities), almost twice as much as was common from 1989 to 2009. The trend reflects a shift in outlook. Elderly Americans’ risk tolerance has shot up."
#economy #markets #investors #investing
Over the past two quarters, S&P 500 stocks have logged the largest earnings day moves since 2009. John Marshall of Goldman Sachs Research discusses what’s driving this dynamic on The Markets: https://t.co/NIj7VG7uOu
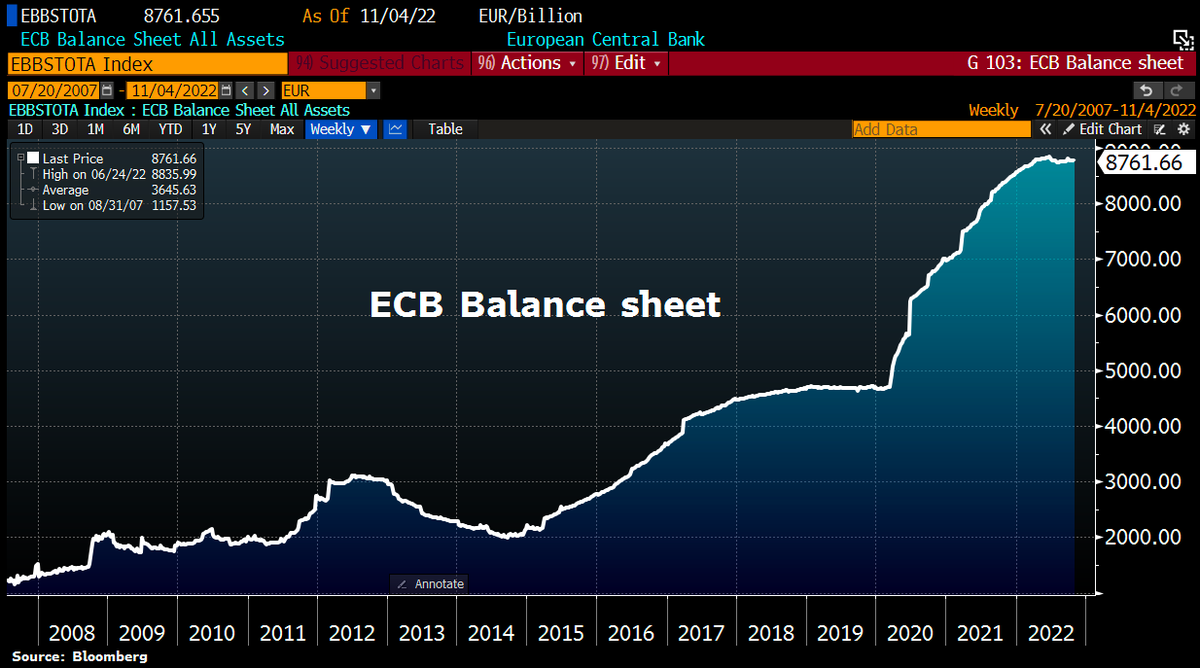
#ECB also lags behind other CenBanks in terms of QT. ECB balance sheet remains almost unch past week. Total assets at €8,761.7bn, equal to 80.9% of Eurozone GDP vs Fed's 33.8% and BoJ's 127%.
European gas and power prices jump after EDF forecast lower nuclear-energy output, adding to pressure on the region’s tight energy supplies https://t.co/BlAEqf1cXg