Measure theory really doesn't help you get better at applied probability. You can be exceptional at applied probability without ever learning measure theory. You can also be excellent at measure theory while being completely incompetent at applied probability
We usually repeat that correlation doesn’t imply causation, which is true. But the reverse, causation doesn’t imply correlation, is ALSO true.
Let X~N(0,1) and Y=X^2. In this example, X causes Y.
But the correlation between X and Y is Corr(X,Y)=Corr(X,X^2)=Cov(X,X^2)/(σ_X*σ_(X^2))=(E[X*X^2]-E[X]*E[X^2])/(σ_X*σ_(X^2))=0. Why?👇
The function h(x)=x^3 is odd:
(-x)^3=-x^3
and the distribution is symmetric around 0, f is even:
f(x)=f(-x)
Thus (x^3)*f(x) is odd (odd*even=odd function) and the integral of an odd function over a symmetric interval is 0.
Thus E[X^3]=∫X^3*f(x)dx=0
(the integral is from -♾️ to ♾️)
The same occurs with the function g(x)=x because g(-x)=-x=-g(x) (it’s odd).
So E[X]=∫X*f(x)dx=0
(the integral is again from -♾️ to ♾️)
Thus Corr(X,Y)=0 because Cov(X,X^2)=0.
Thus we have proven that causation DOES NOT IMPLY correlation.
Q. E. D. ▪️
Remember that calculating a correlation only requires finite variance and finite covariance. Obtaining standard errors and confidence intervals may require distributional assumptions (i.e., bivariate normality) if you are using closed form equations to calculated them. However, you can always bootstrap to avoid those distributional assumptions.
The big catch here is that a correlation describes the entirety of the dependence between X and Y if it is a bivariate gaussian. If it’s not, then it may describe only a portion of the dependence and the dependence may have a much richer structure than a simple linear correlation. Even in these cases, knowing the linear dependence of two non-bivariate-Gaussian random variables may still be useful. This is similar to how a mean and SD (or variance) can fully describe a normally distributed variable, but for other variables, more moments are required (skew, kurtosis, etc) to have a complete description.
Mature democracies have entered a dystopia: the smaller the injustice, the more extreme the response; the greater the injustice, the deeper the bureaucratic indifference.
This is a long semi-technical 🧵 on Tail Risk Hedging. It's unusual, in the sense that I am posting it as I am trying to figure stuff out out of frustration. I find OPP (other people's posts) about Tail Risk Hedging a bit vague or confusing (exception: @bennpeifert).
1/
Modern Machine Learning graduates don’t want to understand how markets operate.
I have many young people on my team. Most of them are very talented and exceptional thinkers. Unfortunately, a recurring problem I see is that they’re so tightly attached to their ML methods that they neglect understanding the market itself.
They spend most of their time fine-tuning their models rather than reflecting on market behaviors. They become frustrated when, after a week or so, they haven’t achieved significant breakthroughs and then devote even more time solely to models.
They don’t study outliers. I constantly receive plots and ask, “What is this outlier?” and frequently hear answers like, “Oh, I don’t know; I don’t need to worry about it because my random forest model will handle it.” That’s disappointing and problematic.
I encourage you to think deeply about markets. Study outliers—understand why they occur, what insights they provide, and whether you should remove or retain them (e.g., data errors, irrelevant data, or valuable signals). All of these aspects are crucial for genuinely grasping market microstructure and building effective event-driven strategies.
There’s no substitute for truly understanding the market. Eventually, you’ll engage in modeling, but always remember that, in most cases, the methods you’ll rely on have been around for about 50 years or more.
@lionel_trolling I tend to think about it as follows. There is an underlying distribution that generates one single result on election day. It could have been an other result as well from that distribution. But we never get to know it. We either have a prior or use one on theoretical basis.
@davidbessis If we consider the evolution of the estimates as random walks, then by the arcsine property, it shouldn’t be surprising that one of the candidates is dominating in most cases. Am I missing something?
Intellectual source and motivation: https://t.co/WnnD61qL77… from the always bright and insightful Peter Medvegyev (nothing to do with *that* Medvedev).
My take on the #Election2024
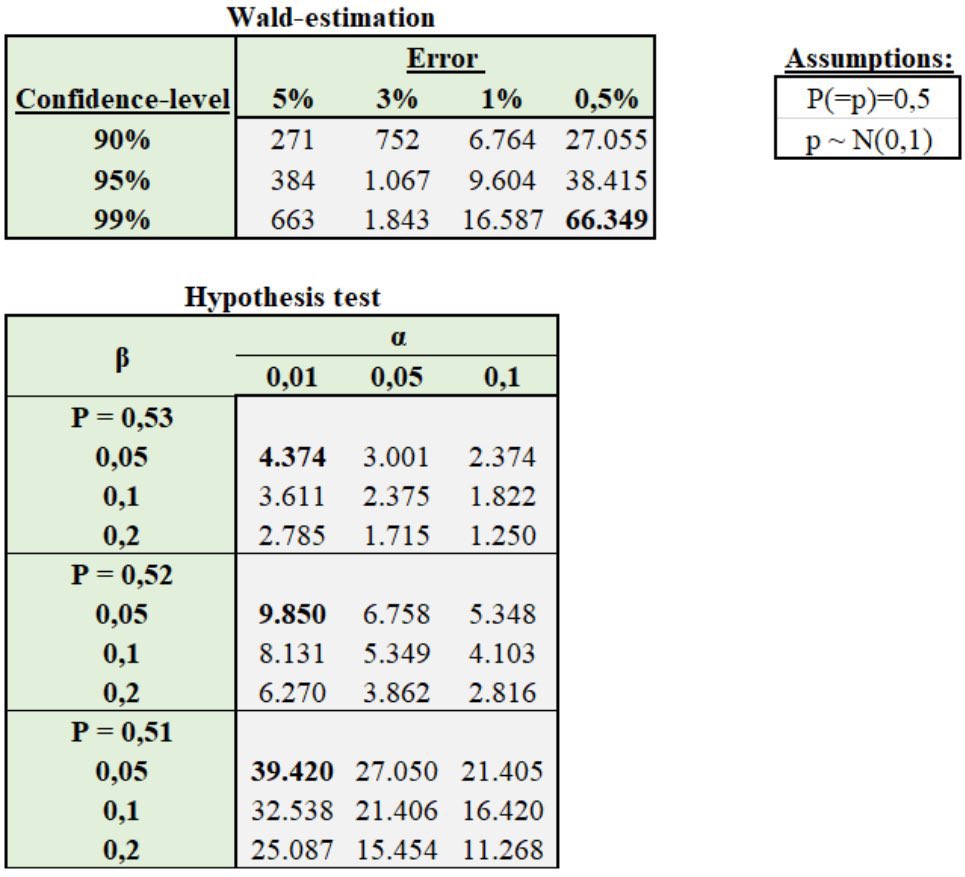
To get an estimate with an error of 0.5% (that is: z*stdev) for a 99% confidence interval, then even with strong assumptions (normality, IID sample, not accounting for speed of convergence, etc.) a sample size of ~ 66.349 would be needed.
To decide whether a 1% difference is significant (as in the case with Trump & Harris) a sample of ~ 39.000 IID. observation would be needed. Clearly not the case in practice. That’s why most polls are unable to “predict” anything.
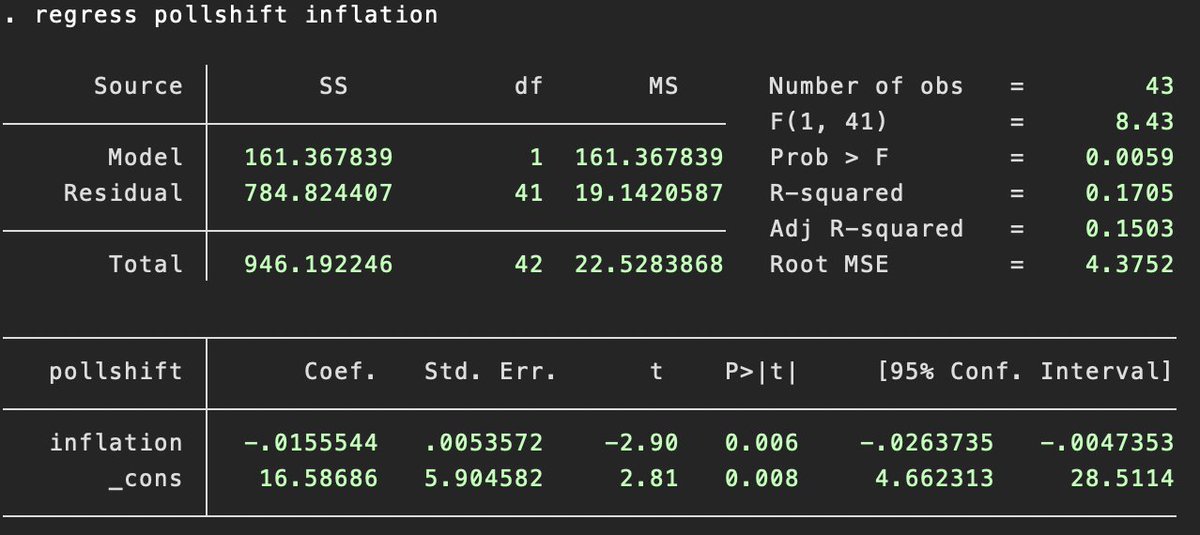
@NateSilver538 So wrong on so many levels. I'm not even questioning if linearity as an assumption holds, because it does clearly not, but not accounting for OVB, strict exogeneity (for causal inference...) or how any asymptotics could possibly hold with n=42 is just pure quackery at this point.
So wrong on so many levels. I'm not even questioning if linearity as an assumption holds, because it does clearly not, but not accounting for OVB, strict exogeneity (for causal inference...) or how any asymptotics could possibly hold with n=42 is just pure quackery at this point.
There are some confounders here, but the inflation thing is actually statistically significant! Each additional $100 of inflation in a state since January 2021 predicts a further 1.6 swing against Harris in our polling average vs. the Biden-Trump margin in 2020.
@kareem_carr Interesting question indeed. Also worth to note that on the other hand, when estimating proportions (e.g. vote share) the the confidence interval around the estimation is higest, when it is around 50%, since in this case the variance is maximized
Possible case of arcsine law for stock prices?
Indeed, Wiener processes have a remarking property that if M is the time for which
W(M) = sup{W(s): s ∈ [0,1]} , then M ~ arcsin
Friends, please read this book by Peter Bloem. This is by far the best intuition builder in Linear Algebra (with of course particular attention to PCA) that I have ever read.
https://t.co/oY1RcTpasN


![FranNunesEcon's tweet photo. We usually repeat that correlation doesn’t imply causation, which is true. But the reverse, causation doesn’t imply correlation, is ALSO true.
Let X~N(0,1) and Y=X^2. In this example, X causes Y.
But the correlation between X and Y is Corr(X,Y)=Corr(X,X^2)=Cov(X,X^2)/(σ_X*σ_(X^2))=(E[X*X^2]-E[X]*E[X^2])/(σ_X*σ_(X^2))=0. Why?👇
The function h(x)=x^3 is odd:
(-x)^3=-x^3
and the distribution is symmetric around 0, f is even:
f(x)=f(-x)
Thus (x^3)*f(x) is odd (odd*even=odd function) and the integral of an odd function over a symmetric interval is 0.
Thus E[X^3]=∫X^3*f(x)dx=0
(the integral is from -♾️ to ♾️)
The same occurs with the function g(x)=x because g(-x)=-x=-g(x) (it’s odd).
So E[X]=∫X*f(x)dx=0
(the integral is again from -♾️ to ♾️)
Thus Corr(X,Y)=0 because Cov(X,X^2)=0.
Thus we have proven that causation DOES NOT IMPLY correlation.
Q. E. D. ▪️](https://pbs.twimg.com/media/HIhXfFaWQAAHrru.jpg)
![VictoremDuctor's tweet photo. Possible case of arcsine law for stock prices?
Indeed, Wiener processes have a remarking property that if M is the time for which
W(M) = sup{W(s): s ∈ [0,1]} , then M ~ arcsin https://t.co/KCUsQbpbBa](https://pbs.twimg.com/media/GaSIkaZWwAApPob.png)


