Sorry guys I forgot a chart that looks bullish currently
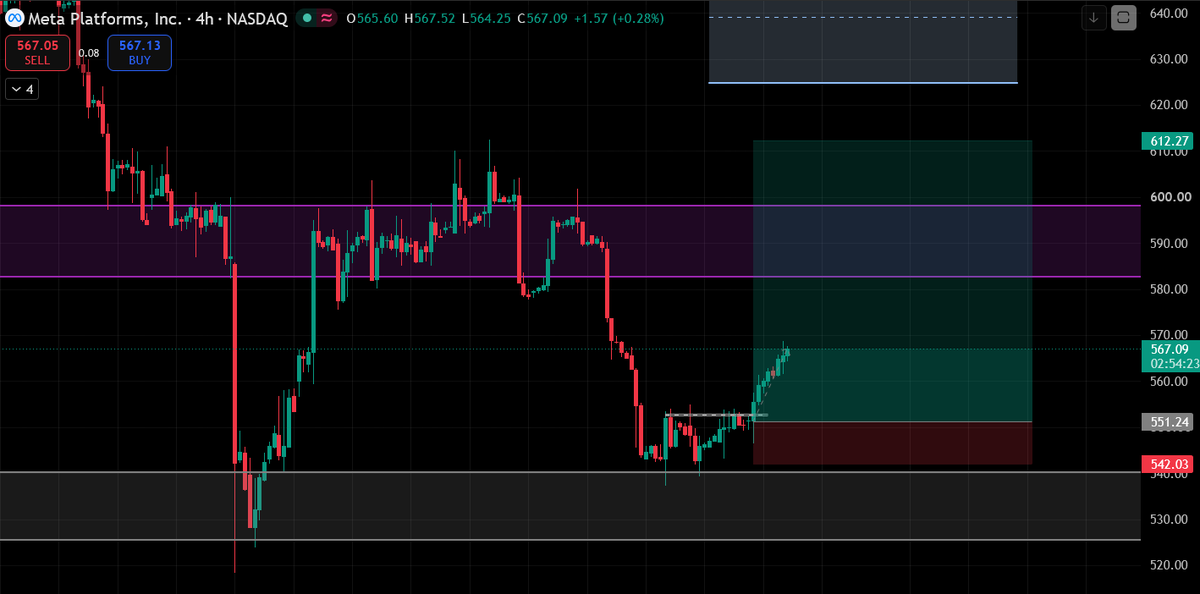
$META
Condition
1. 4hr candle must close above $552.45
2. After that a retracement in 1 hr
Also weekend will start after 3-4 hr
So it’s better to wait until Monday and see how $META reacts under these conditions.
$XCU { COPPER }
Copper looks bullish in 4hr timeframe and also in daily.
Right now there is a breakout of bullish flag pattern happening, But don't long currently because it is also at a resistance.
When long?
- Breakout of bullish flag with 4hr holding above the resistance.
$INTC analyze
Intel corporation stock looks week currently to me.
Because :-
> Loosing its important support zone $89.5 - $87.8
> In daily loosing fib support zone.
> No support available before $70
If it close today candle above the support zone than I will long.
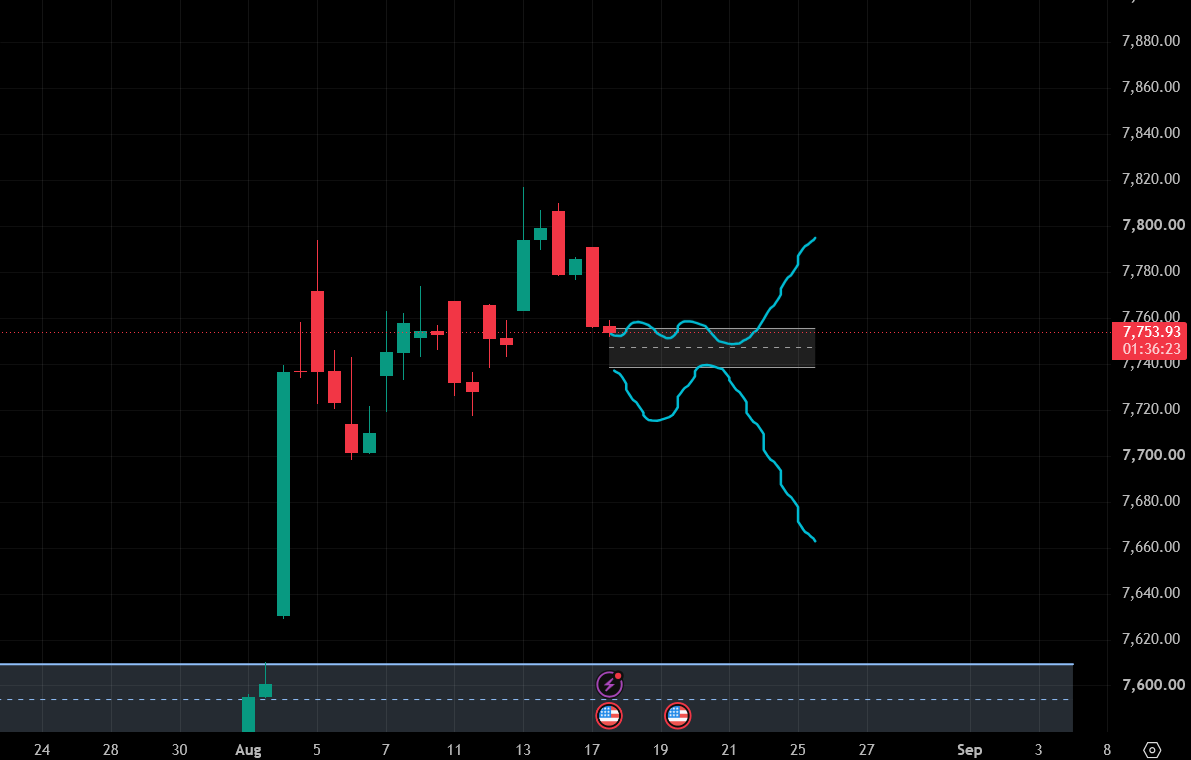
Lets talk about SPX
There are two scenarios left for spx
1. It hold this support area and continue its upward movement.
2. It breakdown the support then we may see a downward move till $7630-$7600 areas.
In my opinion I think SPX will move back towards $7800.
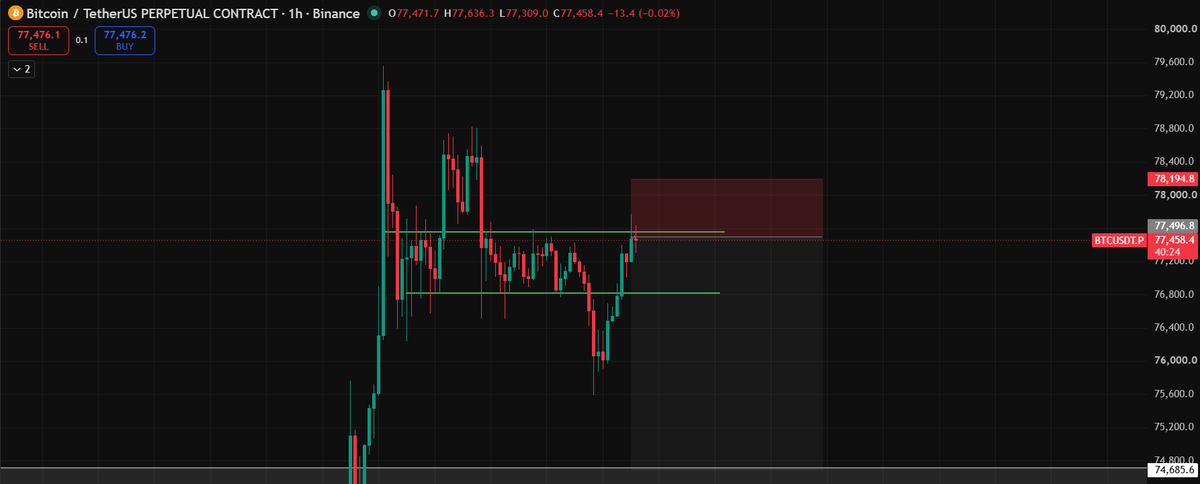
bitcoin:native short
Reasons -
- Taking rejection from its previous consolidation high.
- In 4hr BOS is also done and currently its at 4hr supply zone.
If it start falling only support now is at 74.6k.
Sorry guys I forgot a chart that looks bullish currently
$META
Condition
1. 4hr candle must close above $552.45
2. After that a retracement in 1 hr
Also weekend will start after 3-4 hr
So it’s better to wait until Monday and see how $META reacts under these conditions.
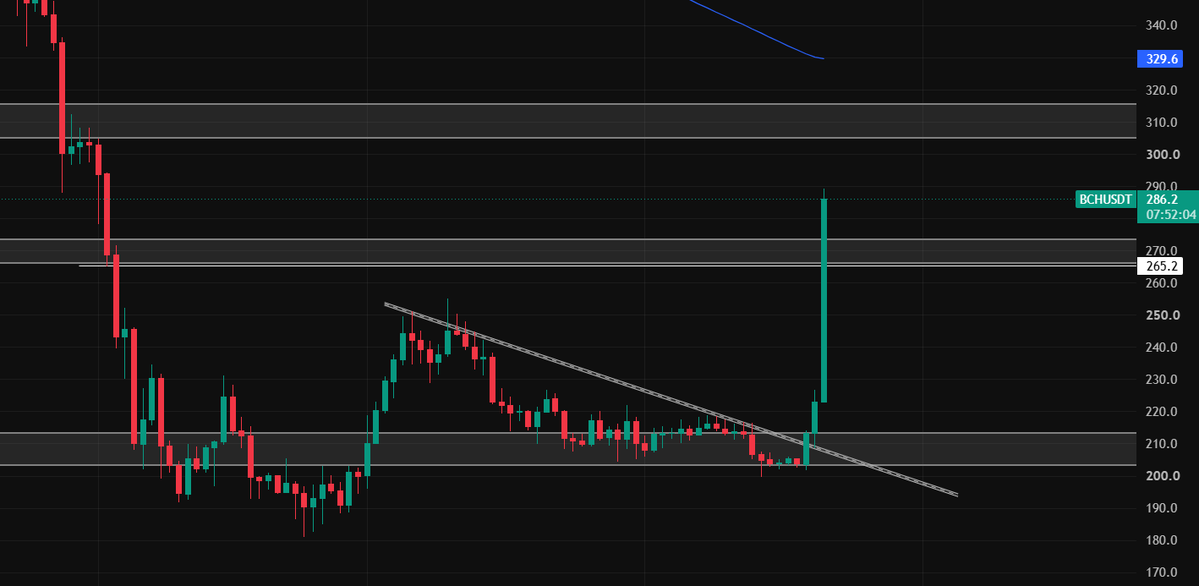
$BCH
As the whole market is pumping, $BCH isn't pumping as much as other ALTs.
But in the 4H it has now flipped the 200 EMA resistance, and there has also been a trendline breakout.
Based on my analysis, I think we could see a breakout toward the $265–$275 area or above.
$BCH
As the whole market is pumping, $BCH isn't pumping as much as other ALTs.
But in the 4H it has now flipped the 200 EMA resistance, and there has also been a trendline breakout.
Based on my analysis, I think we could see a breakout toward the $265–$275 area or above.
Charts speak first >>>> News comes later
On Aug 5 I said that CL was at support now after that it hold that support and pumped.
Current scenarios are clear we may see more upside movement in CL till $92.5. If it breaks 92.5 area with good volume candle than easily go near 115
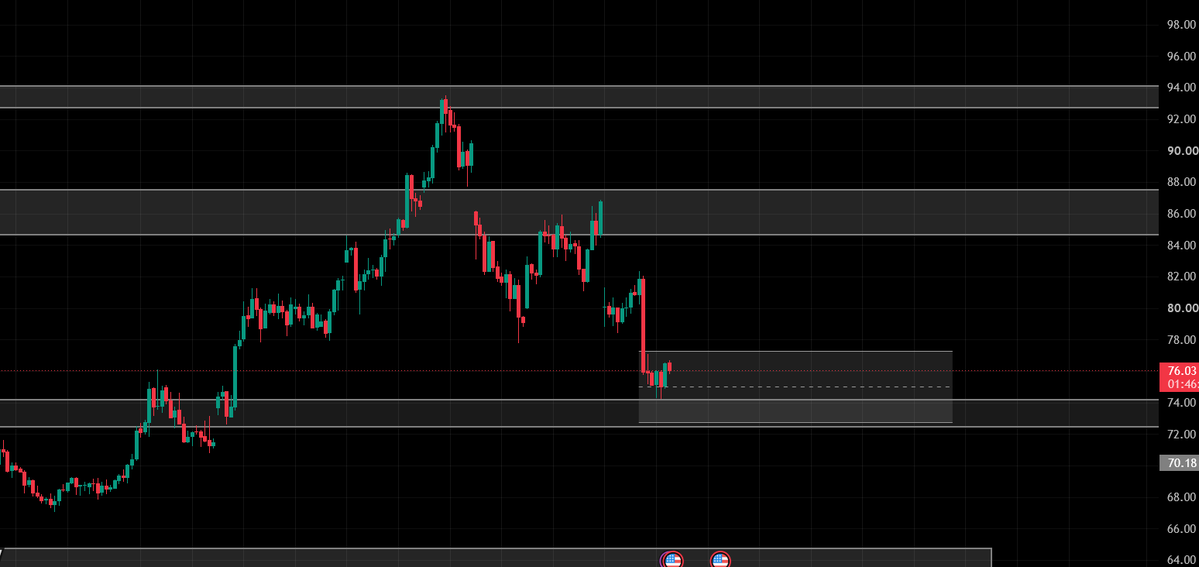
CL {crude oil} update
Now it reaches at its weekly fib area support $72.75 - $77.25 and in 4hr candles are not bad or good its neutral.
Also there was important support at here. So I am expecting a bounce from here and there may be some news which trigger the bounce.
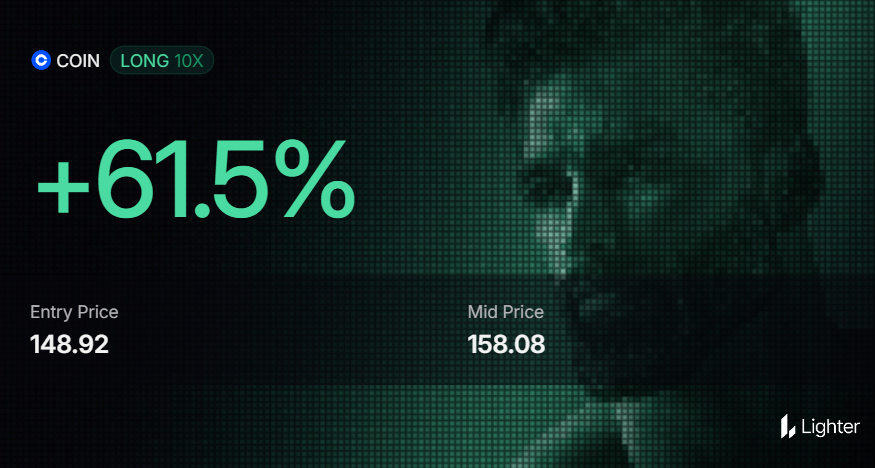
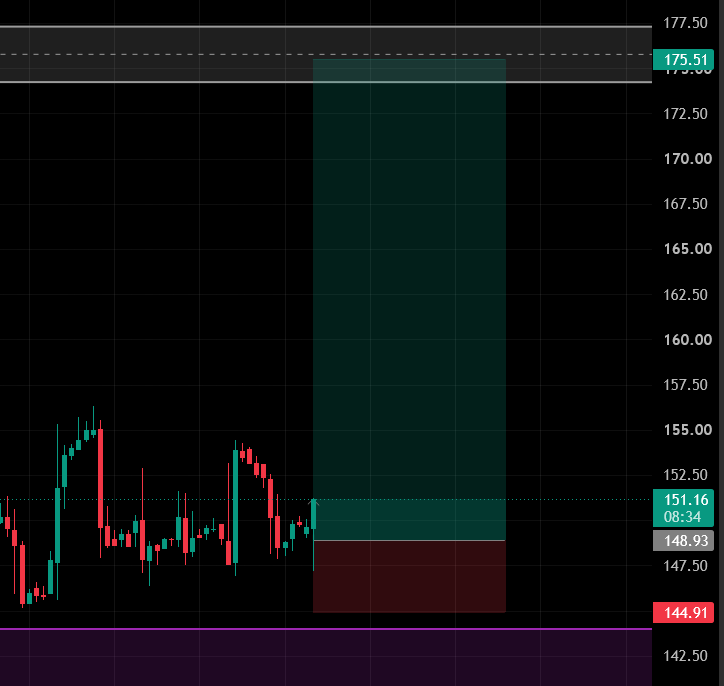
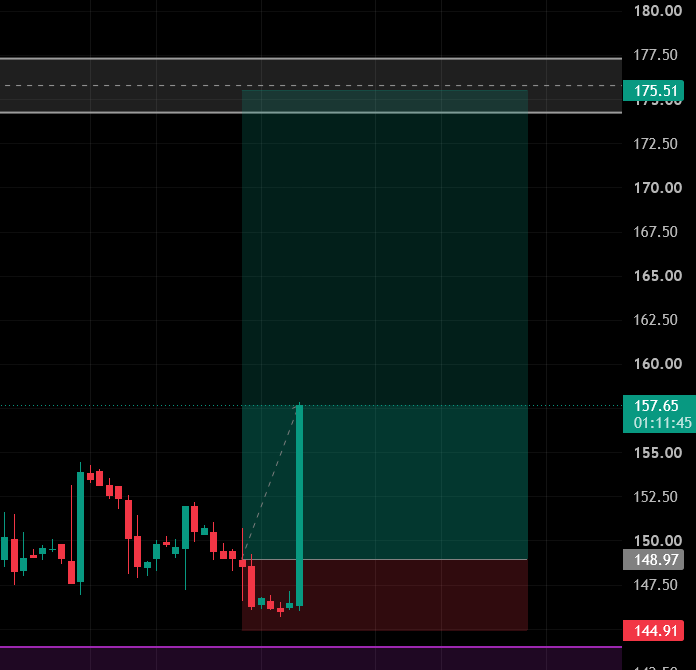
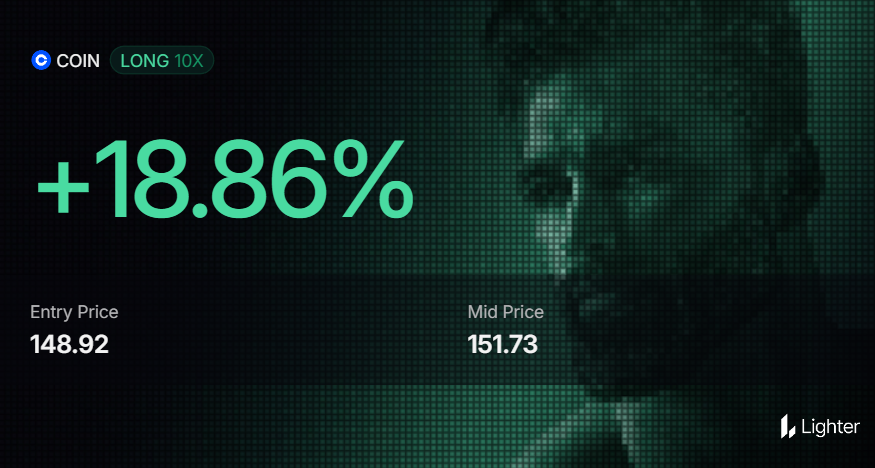
While I have also taken a long in $COIN
WHY?
Because its making a higher high and comes down after hitting the area $155.5. Now I think it will breakout that zone in one go, so at that time may be our SL is not manageable.
$CRCL doesn't look good now
It has done a breakout failure of its previous consolidation range.
Now, entered again in that range.
Note:- It's my trade that I share at here not forcing you to go with them.
DYOR
$CRCL doesn't look good now
It has done a breakout failure of its previous consolidation range.
Now, entered again in that range.
Note:- It's my trade that I share at here not forcing you to go with them.
DYOR
Gm
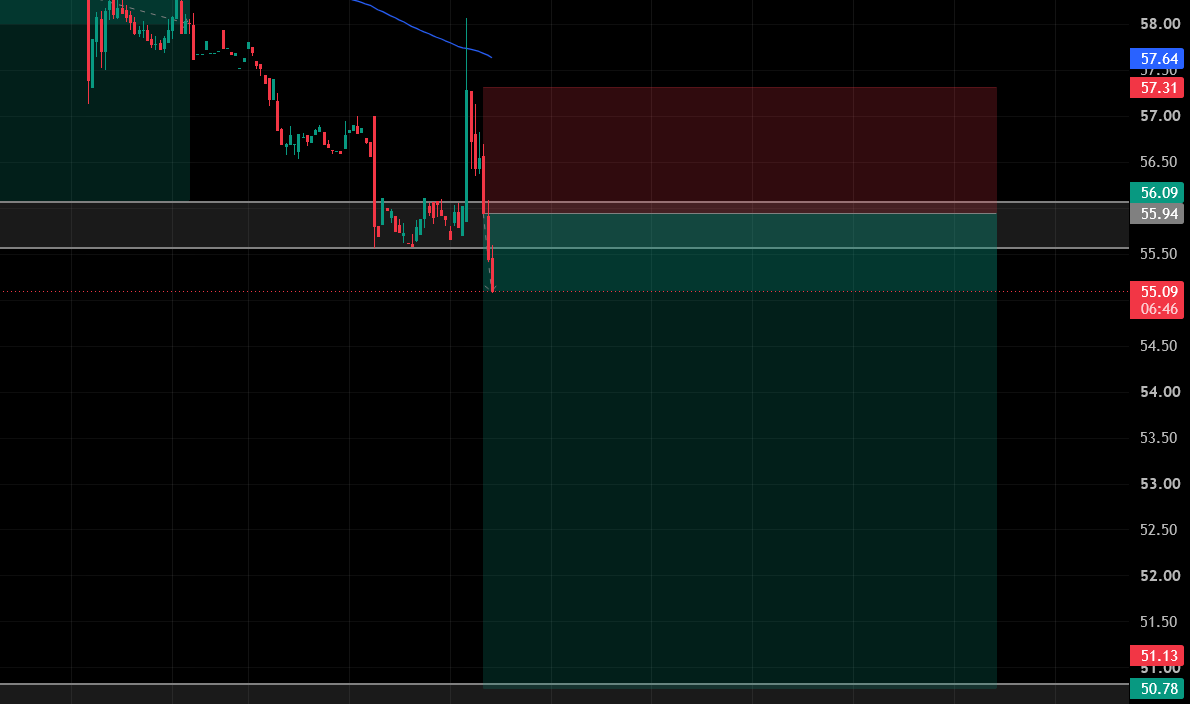
All the three trades taken tomorrow are in profit
- 2 shared in X
- 1 is taken by me personally
$CRWV short - In profit, more than 75% profit booked
$EWY short - 50% booked rest sl on entry
$HPE short - currently running
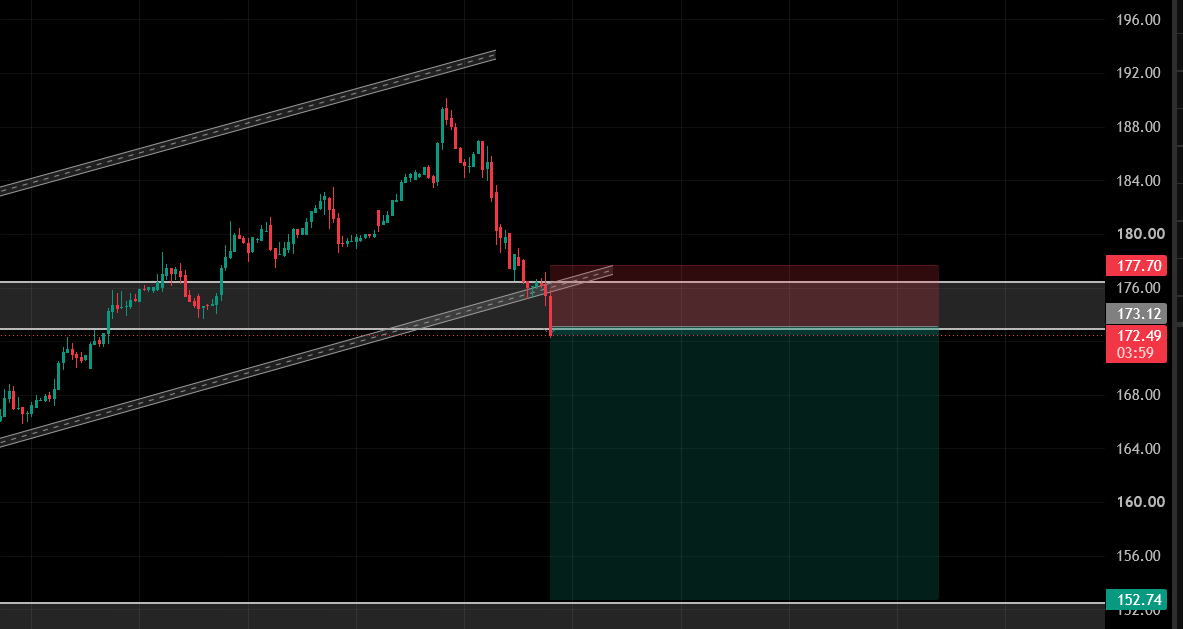
$EWY Short
Reasons of shorting -
1. Breakdown of a Bearish flag pattern
2. With the breakdown it has looses it support of $176.5 - $173
3. Also in 4hr crosses its 4hr EMA downward.