I'm thrilled to announce v2023.1 of the Immersion Analytics Visualizer & Runtime Platform offerings. #analytics#data#datavisualization
See what's new & try it for yourself:
https://t.co/64k9t5tksp
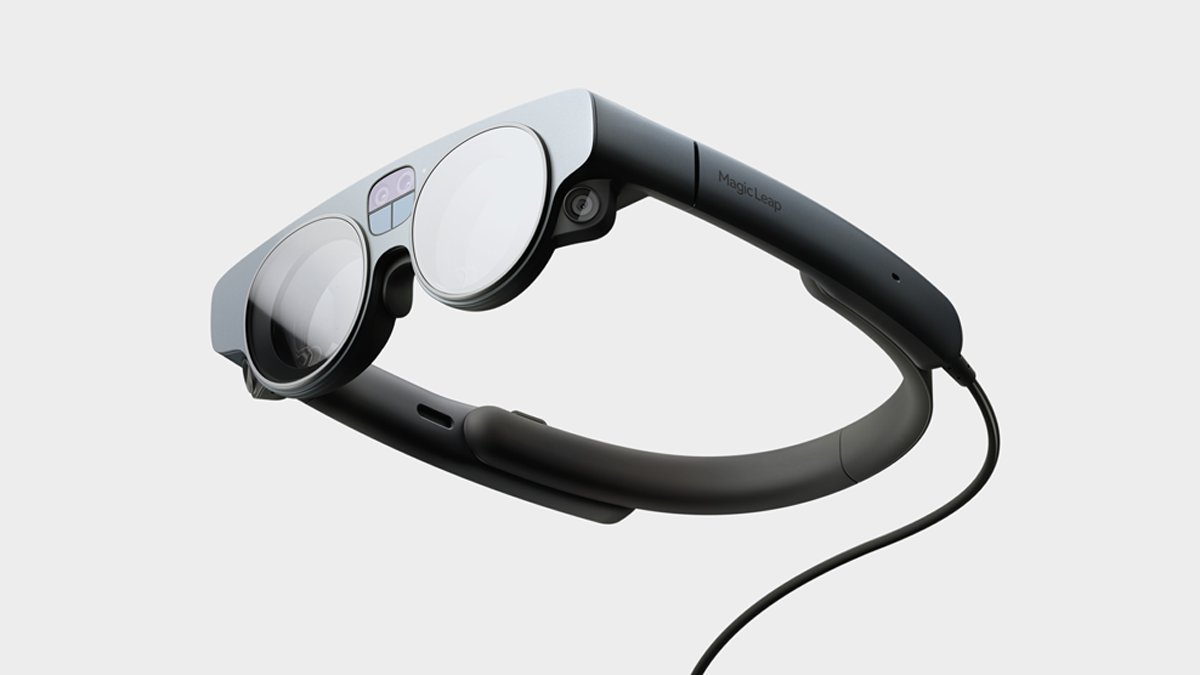
Partners @Microsoft, @magicleap, and @Meta have embraced the value of #Metaverse tech. See how @ImmersionAnalytics Runtime helps other ISV’s bring immersive #Datavisualization to their existing software.
https://t.co/rduwElI3K3
Immersion Analytics is proud to be showcased in @Bloomberg's #Metaverse interview with @magicleap CEO @PeggyJ, check out 0:42 of https://t.co/K2KZDMJnx4
Immersion Analytics is proud to be showcased in @Bloomberg's #Metaverse interview with @magicleap CEO @PeggyJ, check out 0:42 of https://t.co/K2KZDMJnx4
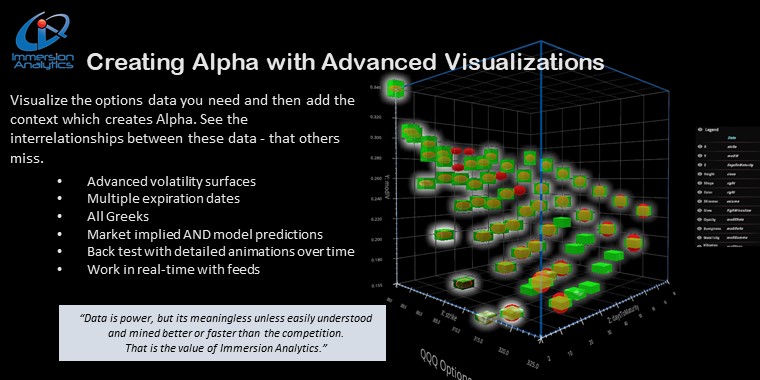
Bob Levy, Founder and CEO of Immersion Analytics – Leader in Immersive Data Visualization – is speaking at #BostonFinTechWeek2021 at 1:00 Thursday 9/30 on Creating Alpha through Advanced Data Visualization. (See the IA booth)
Register today!
#AR#VR#XR#dataviz
Bob Levy, Founder and CEO of Immersion Analytics – Leader in Immersive Data Visualization – is speaking at #BostonFinTechWeek2021 at 1:00 9/28-30 on Creating Alpha through Advanced Data Visualization. (See the IA booth)
Go to https://t.co/ooo4bnAz2w to register today.
@acroll Agreed! Coffee’s default state is black so why waste a button on that. This observation is an allegory of the larger challenge of visualizing multiple data states at the same time - like understanding AI models. @VirtualCove was founded to solve exactly that challenge. #dataviz
Immersion Analytics thanks #Tableau for awarding us 1st Place in their DataDev Hackathon Competition. https://t.co/6Sh8plAwcX - Our video shows how using an immersive computing extension with a #hololens2 augments your BI experience.
Our “IA Visualizer" App is now available on the Apple App Store! Download and experience multi-dimensional data visualizations. #optiontrading example: Menu > Experiences >Open > 4. Options Market. See a smile chart with Calls, Puts, DTM, and Greeks in a single visualization.
#peloton outputs 30+ ride performance metrics. Use #qliksense and #visualizer to understand and visualize that rich data and improve your bike routine. Check out the detailed blog below. Afterward download our new Applestore App: "IA Visualizer https://t.co/WYeXnP4py3
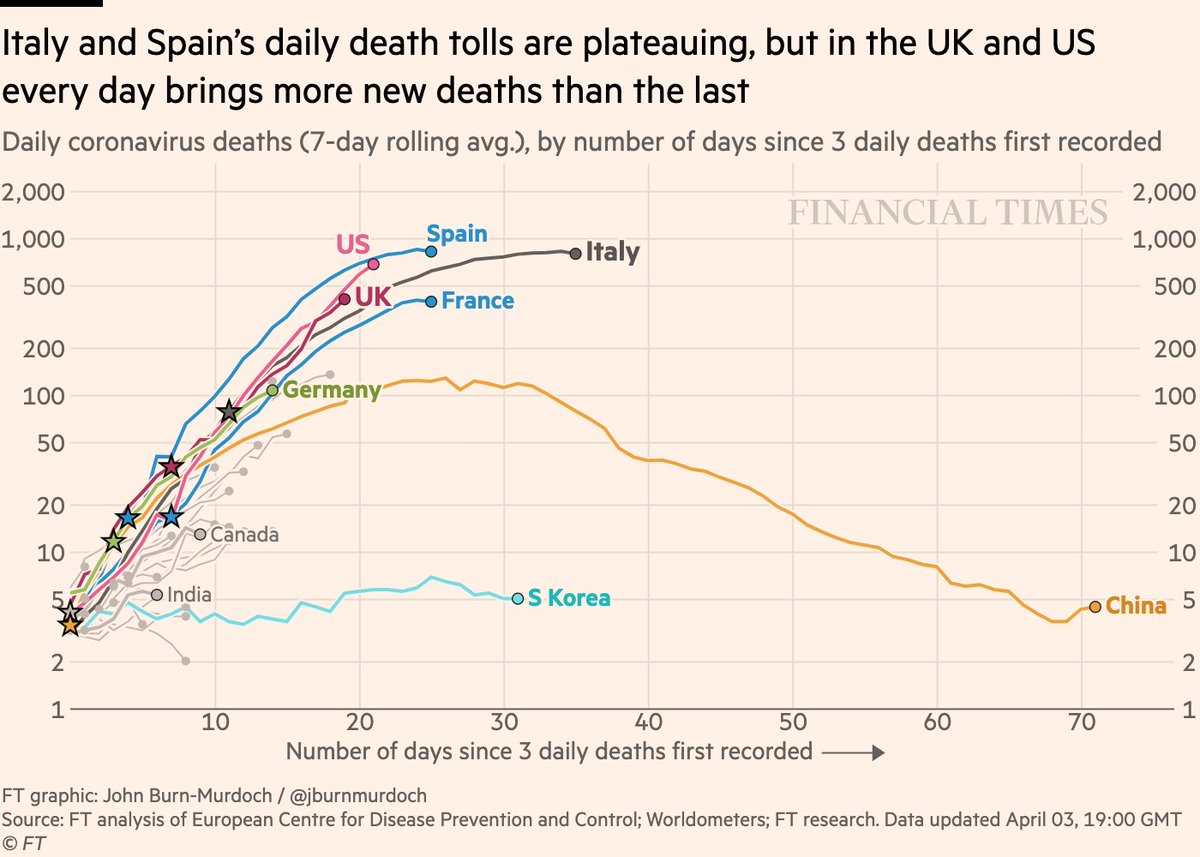
NEW: Fri 3 April update of coronavirus trajectories
First, daily new deaths
• US & UK both likely to pass Spain for peak daily deaths
• Daily death tolls in the thousands to become the norm in US
• UK now clearly steeper than Italy
Live charts: https://t.co/JxVd2cG7KI
Come join Immersion Analytics as we sponsor Qlik’s Data Intergration & Analysis Summit for Financial Services in New York City Feb 26th. Registration is free with this link: https://t.co/y4Dsw0m0l0
@BobLevy8 will be #speaking tomorrow 2/12 at 11:45am on immersive data visualization in the enterprise @ARinACTION at MIT @medialab. The Immersion Analytics team will also be offering hands-on demos of next-generation analytics. Hope to see you there!
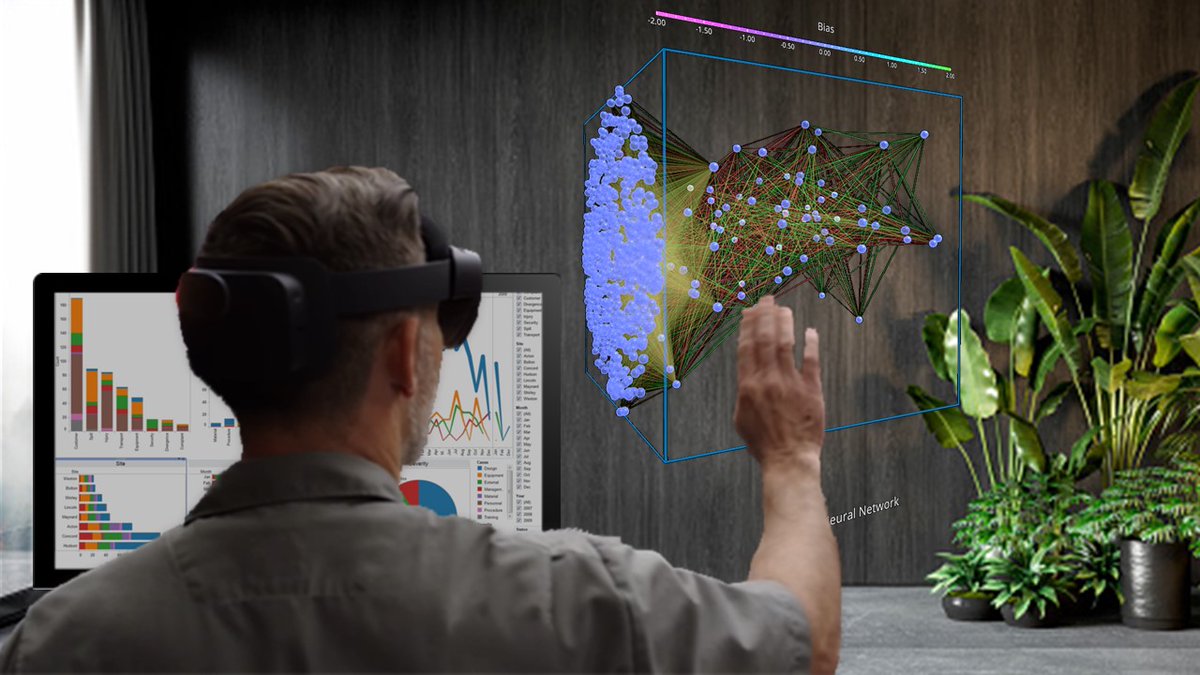
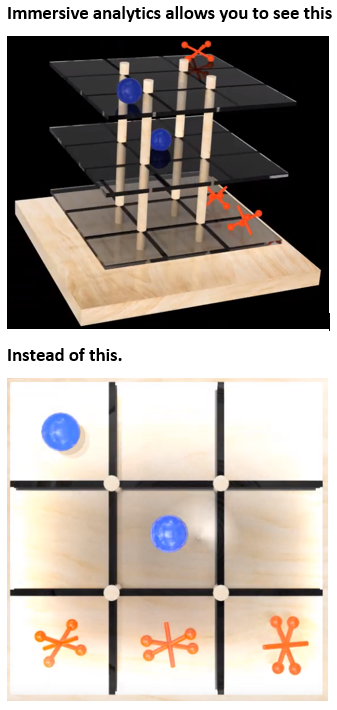
What in the world is #ImmersiveAnalytics you ask? The simplest answer is the image I've shown. Why constrain yourselves to 2 dimensions when your data requires so much more? If you are intrigued you will love this video from @Qlik partner @VirtualCove https://t.co/TNBZCSbYAg