🩸 The Slow Bleed
📉 S&P 500: −$5.8T this week, now ~$61.9T
📊 Yet US stocks traded just 1.03× a normal week
$QQQ $SMH $GLD $IBIT $NVDA https://t.co/FFNoYfvVSR
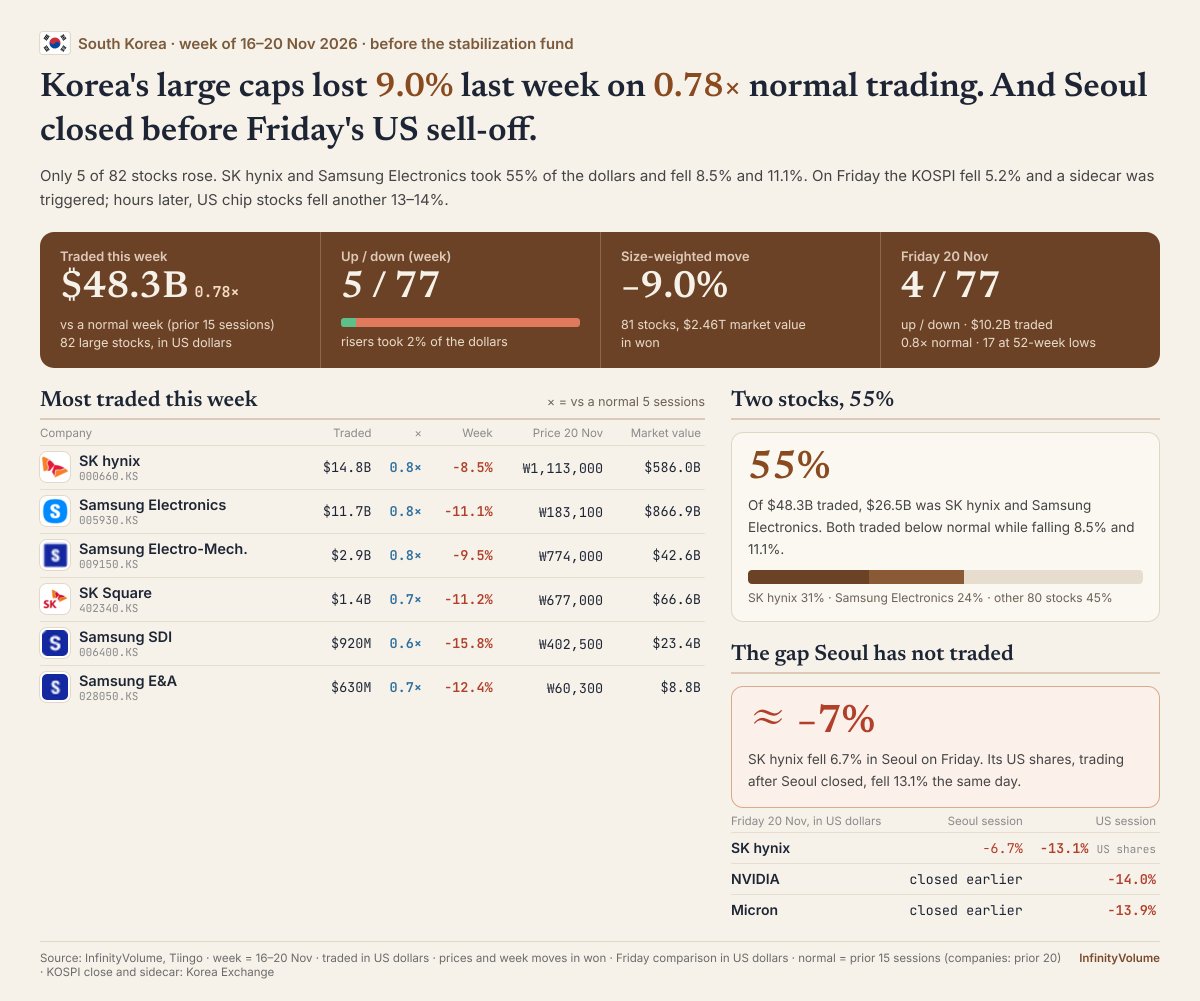
@wallstengine 🇰🇷 Korea's fund lands after a −9% week: 5 of 82 large stocks rose. SK hynix −8.5%, Samsung −11%.
Caveat: Seoul closed before Friday's US sell-off ($NVDA −14%, $MU −14%). That could add another 4–5% downside.
Enough to steady it?
Source: InfinityVolume
🇺🇸 Inside that −11.6% drop:
The highest-beta fifth of 245 large US stocks fell 21%, the lowest-beta fifth 4%.
$NVDA −23% on a beta of 1.8. $MU −24%, $SPY −8.6%.
Which fifth do you hold?
Chart: https://t.co/3ZIHjosETa
The US equity market experienced just one of its sharpest sell-offs on record:
The S&P 500 fell -11.6% from its October 6th peak in just 33 trading days, placing the decline among the 15 fastest corrections since 1928.
By comparison, at the start of the 2022 bear market, it took 34 sessions for the index to fall at least -10%.
During the 2020 pandemic selloff, the same decline took just 6 trading days, while in March 2025 it took 17 sessions.
Overall, 4 of the 15 fastest corrections since 1928 have occurred over the last 6 years.
Meanwhile, 94% of S&P 500 stocks were down last week, with 111 declining by at least -10%.
At the same time, 11 stocks in the index were down by at least -20%.
Market sentiment has become extremely pessimistic.
🇮🇳 While NVIDIA fell 23% last week, HDFC Bank's US shares rose 6.2% on 2.35× the prior week's dollars. Infosys slipped 2.1%.
Their 2026 betas to the US market: 0.79 and 0.12. NVIDIA's is 1.8.
Source: InfinityVolume $HDB $INFY $NVDA
🇺🇸 Where last week's $6.4T of lost market value came from:
NVIDIA: $899B
Its supply chain: $1.75T
The four hyperscalers: $1.08T
The other 207 large stocks: $2.63T
41 stocks, 59% of the loss. One trade unwinding, or the whole market?
Source: InfinityVolume $NVDA $QQQ
🇺🇸 NVIDIA has lost $2.7T of market value since 6 October, down 48%.
Four down weeks: −3%, −9%, −13%, −23%.
The heaviest dollars came the week BEFORE the biggest drop: $398B, then $295B. Sellers finishing, or buyers stepping back?
Source: InfinityVolume $nvda
🇺🇸🇰🇷 지난주(11/16~20) 엔비디아 −22.9%, 10월 6일 고점 대비 −48%.
마이크론 −23.6%, TSMC(미국 상장) −20.1%, SK하이닉스 미국 상장주 −21.4%.
서울의 SK하이닉스는 −8.6%, 삼성전자 −11.3% (달러 기준).
서울은 금요일 미국 장이 열리기 전에 마감했습니다.
출처: InfinityVolume $NVDA $MU
🇺🇸 Last week in one chart: 245 large US stocks, beta against the week's move.
Each extra point of beta cost about 5 points.
Lowest-beta fifth: −4.3%
Highest-beta fifth: −21.3%
NVIDIA fell 23% on a beta of 1.8. Strategy −30%, IREN −35%.
Source: InfinityVolume $SPY $NVDA $MSTR
NVIDIA −23% last week, and the chain around it:
Memory −21%
AI clouds −21%
Foundry and chip equipment −19%
Servers −18%
Rival chips −15%
$2.65T of value gone across 37 hardware names, $0.9T of it NVIDIA's own.
Source: InfinityVolume $NVDA $TSM $MU
✈️ Delta's hub snag follows a rough week for US airlines.
🇺🇸 $ALK −12%, $AAL −10%, $UAL −8%, $DAL −7%
🇪🇺 Lufthansa, Air France-KLM, IAG: all within 4%
🇰🇷 Korean Air −0.6%
11 of 12 traded below normal. Busy skies, quiet tape?
Source: InfinityVolume
Anyone else waiting in disbelief to wake up from a bad dream?
$NVDA, a multi trillion dollar company, is down more in a month than the highest beta names $MU, $BE, $LITE.
@zerohedge 🇺🇸🇨🇳🇰🇷 The saber-rattling week, in dollars:
Cyber +1.5% (Palo Alto +6.5% on 2× normal volume)
China −1.7%; SMIC +13.5%, banks 16 of 17 up
NVIDIA −22.9%, Micron −23.6%, Samsung −11.1%
Coincidence, or positioning?
$PANW $NVDA $MU
Source: InfinityVolume
🇺🇸 SPY just logged its longest losing run in our data (since Nov 2024): 7 sessions, −9.2%.
The week's −8.6% took about $35B of trading per 1% of decline, a third of what typical 2–3% drops took.
Thin fall, thin bids?
$SPY $QQQ
Source: InfinityVolume
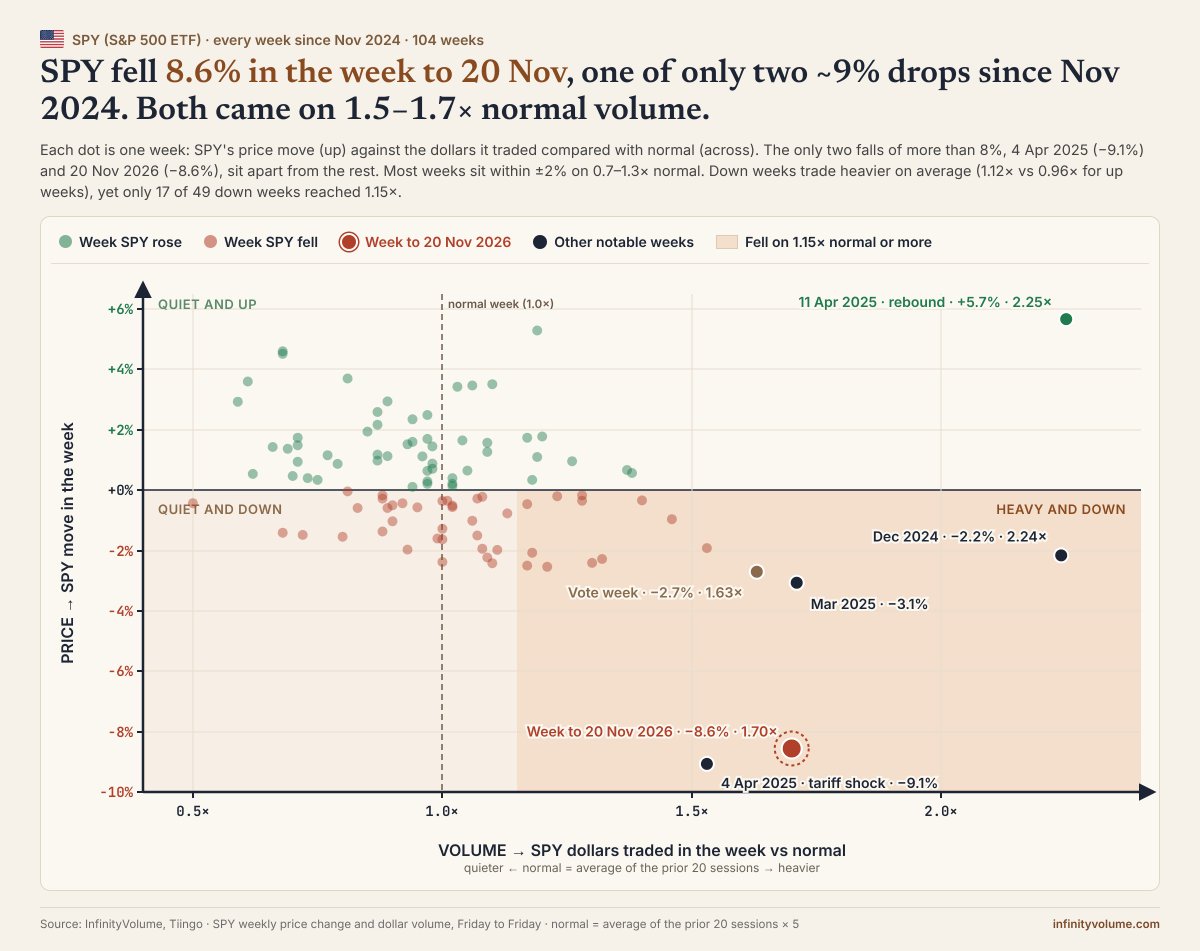
To be precise: 1.70× is SPY's own volume.
All US stocks and ETFs traded just 1.03× a normal week. The extra money went into index funds, while single stocks ran close to normal.
Source: InfinityVolume
SPY's weekly move vs. volume, every week since Nov 2024.
The week to 20 Nov (−8.6%) was one of only two ~9% drops. Both came on 1.5–1.7× normal volume.
The heaviest week of all was the April 2025 (Tariff) rebound (2.25×).
@dailychartbook for the weekend pile
Source: InfinityVolume
@dailychartbook 🩸 The full read: SPY fell 7 sessions in a row (−8.6% on the week), yet US stocks traded just 1.03× a normal week. Only Friday looked like a rush.
Six cards, two years of weekly data:
https://t.co/wtdlLYCqZM
$SPY $QQQ $NVDA $MU $SMH $ANT
🩸 The Slow Bleed
📉 S&P 500: −$5.8T this week, now ~$61.9T
📊 Yet US stocks traded just 1.03× a normal week
$QQQ $SMH $GLD $IBIT $NVDA https://t.co/FFNoYfvVSR
@NikkeiAsia The report lands on a trade already unwinding: Mitsubishi Heavy is −48% from its 2 Mar high, Kawasaki Heavy −59%, IHI −53%.
This week 5 of 6 Japanese defence names traded below normal.
Source: InfinityVolume