Closed my $BTC short a few days ago after the local bottom formed…
From a TA perspective it didn’t make sense to hold..
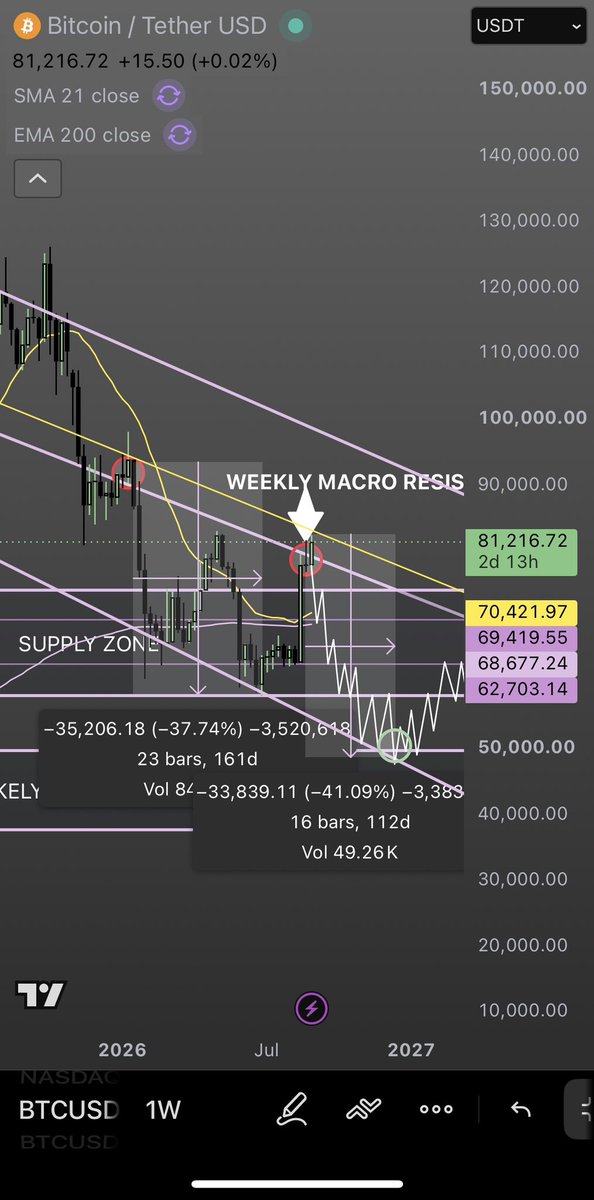
I still have a bearish bias towards the current market longer term but awaiting a sweep of 83-84k before I enter another short🩸
83-84k is our weekly macro resistance level from our existing macro downtrend this bear market… if the bottom truly hasn’t arrived yet, this level will be a very good entry point for our short✅
#CryptoTrading #Crypto #Cryptocurrency #XRP #SUI #BTC #SOL $BTC $XRP $SUI $SOL $ETH #ETH
2017 we top at 19.8k - 300 days later -70%
4 days after this fake bottom we pump 24% in 4 days
From this top it then takes a further 60 days until our true bottom
2021 we top at 69k - 300 days later -70%
6 days after this fake bottom we pump 22% in 6 days
From this top it then takes a further 69 days until our true bottom
Noticing a pattern yet ?
2025 we top at 126k - 315 days later -50%
Fake bottom range of 58-62k
4 days later we pump 25% in 4 days
Going off this pattern we should still have 60-80 days left until our true bottom
This coincides with bitcoins historical 4 year cycles and determines our exact bottom date to be somewhere between the end of October to the early days of November if history were to repeat.
#CryptoTrading #Crypto #Cryptocurrency #XRP #SUI #BTC #SOL $BTC $XRP $SUI $SOL $ETH #ETH
Praying for you 🙏🏼 I do also think we haven’t bottomed yet… great chance at your trade recovering.
Been keeping an eye on one of my charts here.. possibility we sweep 83k first before reversal plays out but from a time perspective we only really have about 1-2 months for this to happen if we are to go off previous cycles..
Good luck 👊🏼
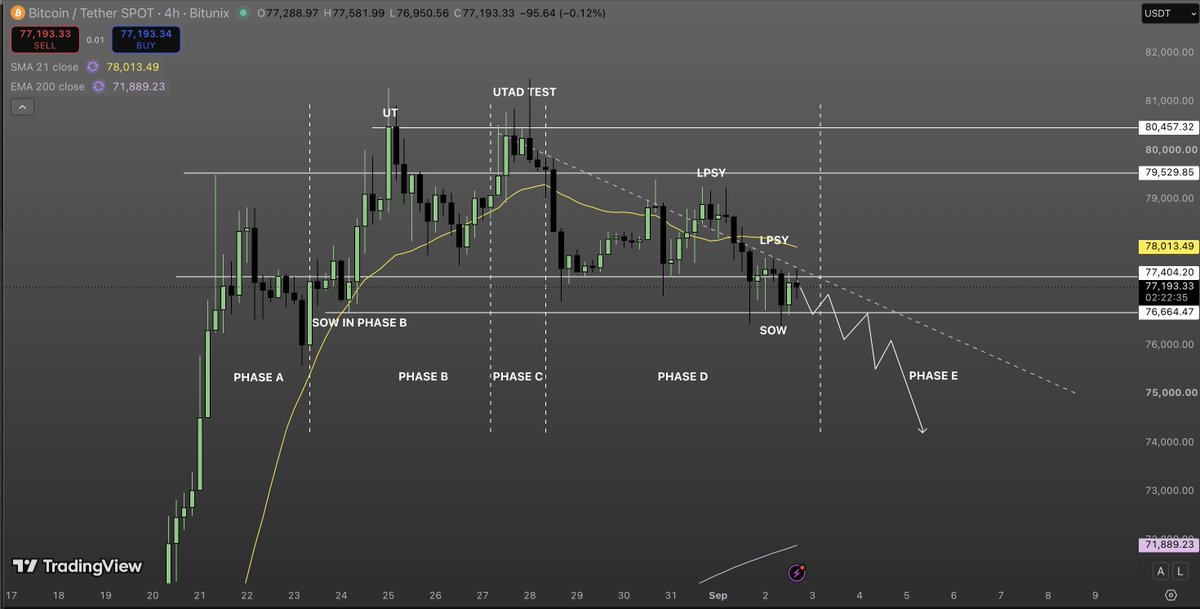
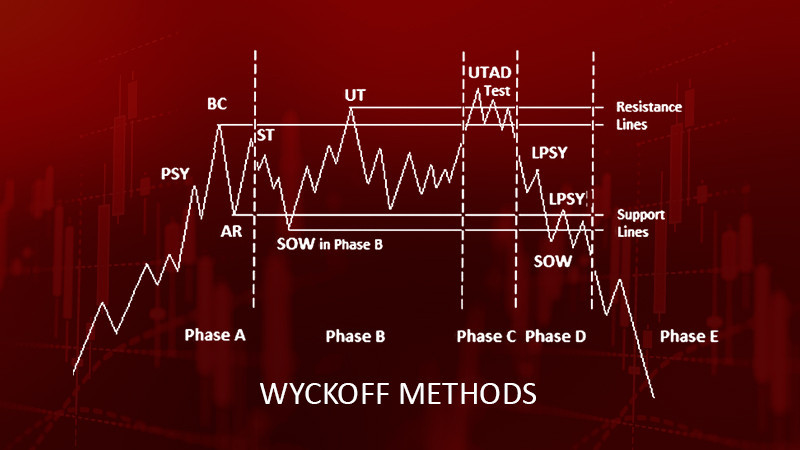
Not perfect but this is definitely some form of wyckoff distribution
All my technical analysis the past week or so has pointed towards bears taking over momentum, allowing for a move lower and a further sell off to take place
Expecting price to drop catastrophically once we enter Phase E
Position yourself accordingly 🩸🐻
#CryptoTrading #Crypto #Cryptocurrency #XRP #SUI #BTC #SOL bitcoin:native #ETH
Last time we rejected from this trend line we saw a harsh sell off of almost 40%.
Expecting something similar in the coming months if we see further bearish price action this week.
This is how I see the market panning out over the next 60-100 days with a potential full reversal to take place in early December.
#CryptoTrading #Crypto #Cryptocurrency #XRP #SUI #BTC #SOL bitcoin:native ripple:native $SUI $SOL $ETH #ETH
Not perfect but this is definitely some form of wyckoff distribution
All my technical analysis the past week or so has pointed towards bears taking over momentum, allowing for a move lower and a further sell off to take place
Expecting price to drop catastrophically once we enter Phase E
Position yourself accordingly 🩸🐻
#CryptoTrading #Crypto #Cryptocurrency #XRP #SUI #BTC #SOL bitcoin:native #ETH
Not perfect but this is definitely some form of wyckoff distribution
All my technical analysis the past week or so has pointed towards bears taking over momentum, allowing for a move lower and a further sell off to take place
Expecting price to drop catastrophically once we enter Phase E
Position yourself accordingly 🩸🐻
#CryptoTrading #Crypto #Cryptocurrency #XRP #SUI #BTC #SOL bitcoin:native #ETH
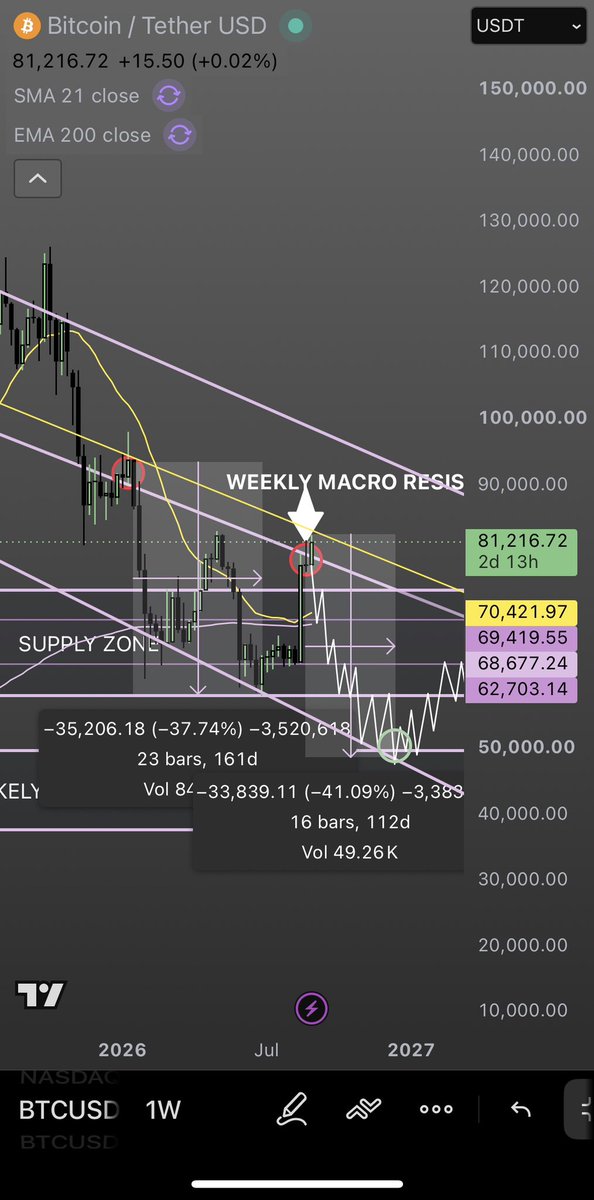
Last time we rejected from this trend line we saw a harsh sell off of almost 40%.
Expecting something similar in the coming months if we see further bearish price action this week.
This is how I see the market panning out over the next 60-100 days with a potential full reversal to take place in early December.
#CryptoTrading #Crypto #Cryptocurrency #XRP #SUI #BTC #SOL bitcoin:native ripple:native $SUI $SOL $ETH #ETH
Last time we rejected from this trend line we saw a harsh sell off of almost 40%.
Expecting something similar in the coming months if we see further bearish price action this week.
This is how I see the market panning out over the next 60-100 days with a potential full reversal to take place in early December.
#CryptoTrading #Crypto #Cryptocurrency #XRP #SUI #BTC #SOL bitcoin:native ripple:native $SUI $SOL $ETH #ETH
2017 we top at 19.8k - 300 days later -70%
4 days after this fake bottom we pump 24% in 4 days
From this top it then takes a further 60 days until our true bottom
2021 we top at 69k - 300 days later -70%
6 days after this fake bottom we pump 22% in 6 days
From this top it then takes a further 69 days until our true bottom
Noticing a pattern yet ?
2025 we top at 126k - 315 days later -50%
Fake bottom range of 58-62k
4 days later we pump 25% in 4 days
Going off this pattern we should still have 60-80 days left until our true bottom
This coincides with bitcoins historical 4 year cycles and determines our exact bottom date to be somewhere between the end of October to the early days of November if history were to repeat.
#CryptoTrading #Crypto #Cryptocurrency #XRP #SUI #BTC #SOL $BTC $XRP $SUI $SOL $ETH #ETH
Whatever you do, never listen to this man. He is somehow wrong 90% of the time. It’s actually pretty sad at this point.
$BTC isn’t currently in a bull flag pattern. It’s never looked more toppy in its life. Clarity act is being priced in as we speak (will not pass)
Wouldn’t be surprised to see $72k by the end of the day. This sell of is going to be generational. It will go down as quick as it went up.
I’ve flipped bullish on bitcoin:native, raging bull flag from a TA perspective. No liquidity grab on the weekend from longs. + we have the digital asset clarity act on Sep 15th. Classic buy rumour, sell news event. Got some longs on with SL. Wouldn’t be surprised to see 85-90k within the next 10 days. Let’s make some money.
2017 we top at 19.8k - 300 days later -70%
4 days after this fake bottom we pump 24% in 4 days
From this top it then takes a further 60 days until our true bottom
2021 we top at 69k - 300 days later -70%
6 days after this fake bottom we pump 22% in 6 days
From this top it then takes a further 69 days until our true bottom
Noticing a pattern yet ?
2025 we top at 126k - 315 days later -50%
Fake bottom range of 58-62k
4 days later we pump 25% in 4 days
Going off this pattern we should still have 60-80 days left until our true bottom
This coincides with bitcoins historical 4 year cycles and determines our exact bottom date to be somewhere between the end of October to the early days of November if history were to repeat.
#CryptoTrading #Crypto #Cryptocurrency #XRP #SUI #BTC #SOL $BTC $XRP $SUI $SOL $ETH #ETH
Hi @grok since bitcoins creation, we have operated in 4 year cycles correct ? The bear market typically lasts for a year... from each cycles top, since bitcoins creation, tell me how many days it took to reach the bottom of the bear market. Apply this same logic to the current market, would this put us in the anger stage based off current price action?
@cozypront DAILY CHART
80-98k was complacency
98-60k was anxiety
66-82k was denial
82-59k was panic
We are currently hitting the top of the anger stage.
Depression to follow in the next 60 days.
See you at 48k.