One agent. One computer. Built for finance.
Most AI tools wait for you to ask. We don't.
WatchWise runs 24/7 — earnings scans, expectation gap analysis, alt-data signals, cross-asset monitoring. Research before you ask. Always ready.
This is what a 24-hour research team looks like when it never sleeps.
Watch Wise. Invest Wise.
One agent. One computer. Built for finance.
Most AI tools wait for you to ask. We don't.
WatchWise runs 24/7 — earnings scans, expectation gap analysis, alt-data signals, cross-asset monitoring. Research before you ask. Always ready.
Watch Wise. Invest Wise.
Grok Bot is great. We've been building Mira on the same idea since day ONE: an always-on AI research team. The difference: Mira is specialized in finance, with multiple customizable personas.
Hedge funds with a combined AUM of over $500B have tested her. They keep using her.
She's designed and built by portfolio managers, with 10+ years at top-tier hedge funds.
Where we are:
• Our AI analyst team is live. The beta runs 24/7, and we're about halfway to making her proactive.
• Our financial models are built natively for AI, as data and algorithms, not spreadsheets. So we decided: NO MORE EXCEL for financial modeling.
• Free for now. Every tool is being tested against institutional standards.
• The UI is temporary. Want something different? Tell us.
The goal hasn't changed: build the best AI analyst team, encoding decades of portfolio management experience into one system. We're not there yet.
GPU cloud rents are rising. FinTwit says "NVDA pricing power is back."
The data says otherwise.
90-day on-demand GPU pricing (WatchWiseAI tracking, 135+ providers, Sep 16 snapshot):
1. B200: $6.25/hr median. P25-P75 spread is extreme — peaks hit $10+. Only 27 providers offer it. Scarcity pricing, not structural power. When supply normalizes, premium collapses.
2. H200: $3.50 to $4.00+ in 90 days. Steady climb = migration tax. Labs rotating from H100 to H200 for larger context. Demand rotation, not surge.
3. H100 SXM: $3.00-3.20, dead flat 90 days. The workhorse that funded 75% GM is commoditizing. Stable price = no premium. It is becoming a commodity.
4. RTX 4090: $0.50/hr, flat. Inference does not need H-class. Training-to-inference gap is 12x. That gap closes downward.
The real signal: rental inflation helps neoclouds who locked B200 inventory. It squeezes players who cannot access Blackwell supply. Bifurcation accelerating.
NVDA $214.26, Fwd PE 23.4x. Market reads rising rents as margin support. But H100 commoditization + B200 scarcity premium = margin trajectory still pointing down. Physical switch: B200 provider count. When n=27 becomes n=100, the premium evaporates.
$NVDA $CRWV $MU
The Fed hiked 25bps to 3.75-4.00%. 12-0 unanimous. Dot plot median: 4.1% through end-2027. PCE inflation 3.7%. Core 3.4%.
Translation: rates stay high for another year minimum, inflation nearly double the 2% target.
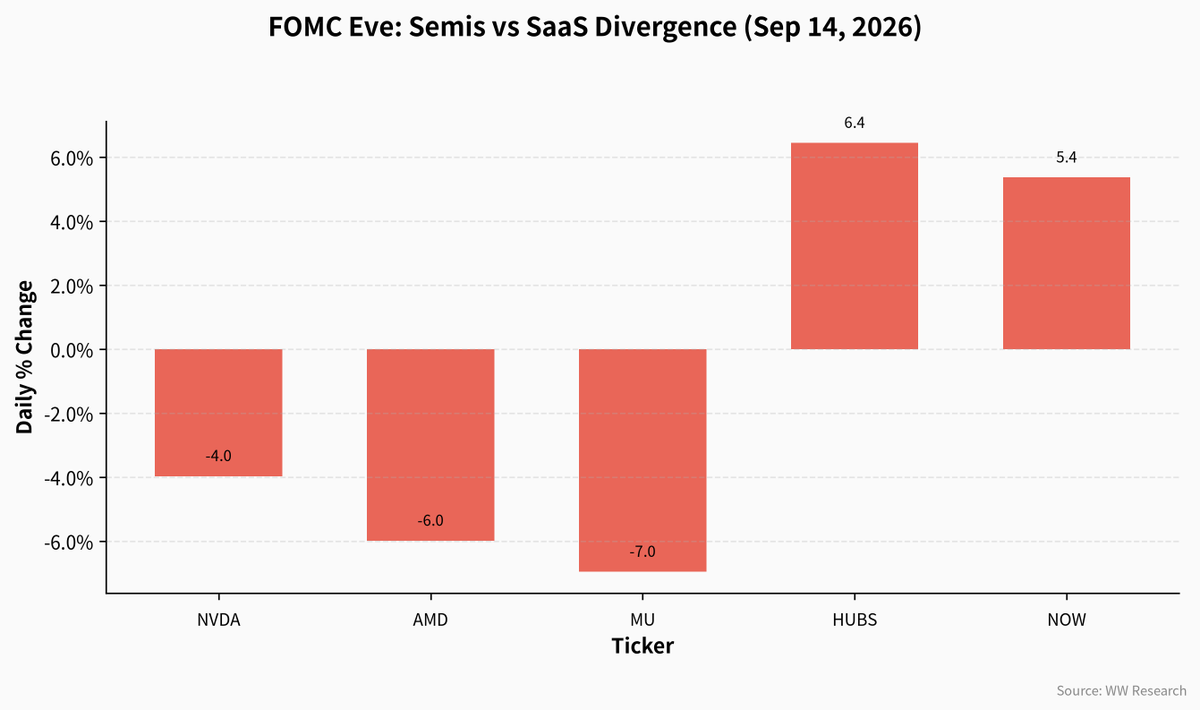
A yawn. The most hawkish possible outcome — unanimous hike, rates held at 4.1% through 2027, inflation at 3.7% — and VIX moves 3%.
The highest-duration assets on the planet — semis trading at 20-60x forward PE — went UP after a hawkish hike.
SaaS with sticky revenue and positive FCF — the textbook rate-resilient basket — got sold.
The market is doing duration math backwards.
At 5% risk-free, a 60x PE stock discounts 60 years of future earnings. The Fed just said rates stay at 4.1% through 2027. And semis rallied.
This is not complacency. It is mispricing.
$NVDA $AMD $MU $HUBS $NOW $CRM
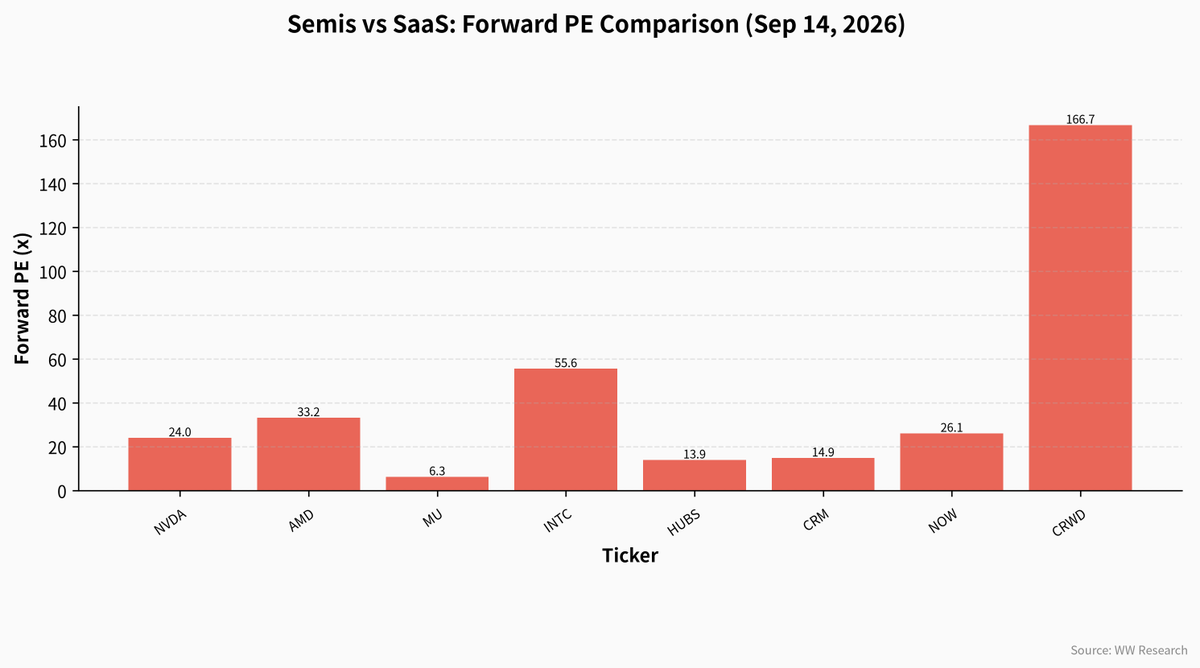
$NVDA Fwd PE 24x. $HUBS 14x. $CRM 15x. The market is rotating from expensive semis to cheap SaaS — but reading the catalyst completely wrong.
1. IREN CEO (Sep 14): "Even if models never improved from here, just rolling out what they can already do would take more compute than the world can build for years." Demand isn't falling.
2. "Slowdown" = labs spend MORE compute on alignment, monitoring, evaluation — not less. Pace shifts demand from high-ASP training chips to lower-ASP inference chips. Compute demand up, lab margins down. (Same as we do now)
3. PLTR, NVDA, Booz Allen restricting Anthropic's Fable model over data-retention concerns (Sep 15). Competitive moat behavior = model commoditization pressure accelerating.
The physical switch isn't model pace. It's compute mix shifting from high-ASP training to low-ASP inference — and NVDA margin erosion accelerates in that world, not decelerates.
$NVDA $HUBS $CRM $NOW $MU $AMD
FOMC Wednesday. The market is binary. The reality isn't.
Three scenarios for Wednesday:
A) Hike + hawkish dot plot (40%): 10Y breaks 5%, semis -3-5% more, SaaS flat to -1%, gold +2-3%, DXY peaks and reverses on "buy the news"
B) Hike + dovish tone (35%): 10Y holds 4.9-5.0%, semis flat, SaaS +2-3% relief rally, gold +3-4%
C) Hold (25%): semis +3-5% squeeze, SaaS +1-2%, gold +4-5%, but 30Y keeps climbing because hold = fiscal dominance unaddressed
The contrarian signal: Dollar positioning is max long into Wednesday. A hike is priced. The surprise risk is downside for DXY, not upside.
For portfolios: NVDA at 24x Fwd PE, AMD at 33x, MU at 6x (cycle-top trap) face the most repricing risk. HUBS at 14x and NOW at 26x with sticky revenue and positive FCF are rate-resilient. Today's divergence proves the thesis.
Physical switch: dot plot + Warsh press conference tone. Not the 25bp.
$PATH +1.92% to $18.57. Barely beat. The market yawned for a reason.
1. EPS $0.15 vs $0.1485 est — +1.0% surprise. Last quarter was -5.9% miss. Beat streak broken then barely repaired
2. Revenue $0.41B vs $0.40B est — +3.1%. ARR $1.94B (+12% YoY), NRR 109%
3. Adj. GM 82%, adj. OM 22% (non-GAAP). GAAP OM only 7.3% — the gap matters
The beat is thin. +1.0% EPS surprise after a -5.9% miss last quarter is not recovery — it is stagnation at a lower base. Net New ARR $37M with NRR 109% means expansion is happening but decelerating vs peers.
Cash & ST investments $1.28B. Zero debt. OCF ~$30M. Clean balance sheet but capital efficiency is not the question — growth reacceleration is.
Q3 guide: Rev $442.5M, ARR $1.995B. FY27 guide: Rev $1.792B, ARR $2.068B. Guide raised but modestly — not a blowout raise.
Forward PE 22.62x prices growth. 1Y +67.46%, 3M +62.1% — the run was massive. At 22x forward with beat quality deteriorating (+87.5 → +8.7 → +20.0 → -5.9 → +1.0%), the risk is "not good enough" on a crowded trade.
The real question: is agentic AI a tailwind or headwind for RPA? PATH is the purest test case. NRR 109% says retention holds. But Net New ARR $37M says new logo growth is anemic. AI agents could either supercharge platform value or make traditional RPA obsolete.
Physical switch: Net New ARR acceleration. Q3 prints >$50M = AI tailwind confirmed, re-rate. Stays at $30-40M = slow bleed, 22x has no floor.
$PATH
$DOCU beat Q2. Stock +7.12% to $70.67. 5th consecutive EPS beat — but the quality tells a different story.
1. EPS $1.16 vs $1.09 est (+6.4%) — 5th straight beat: +6.4% / +9.7% / +6.3% / +10.3% / +8.6%
2. Revenue $875.7M vs $867.4M est (+1.0%) — +9% YoY but beat is margin-driven, not top-line
3. FCF $295.8M vs $234M est — real cash generation beat
Forward PE 14.35x. Net cash $0.35B, OCF $334.5M. Balance sheet clean.
But guidance was in line, not raised. FY27 rev $3.50-3.51B vs $3.5B est. Q3 rev $886-890M vs $889M est. The market wanted a raise after 5 beats — got stability instead.
IAM % of ARR: 15.1% → guiding 18-19% by Q4 exit. CEO: "AI agents are now securely executing contract workflows end-to-end." This is the scaling narrative — but Non-GAAP GM 81.7% is -30 bps YoY. AI investment is costing margin.
1Y -13.08% despite 5 consecutive beats. YTD +1.73% — barely positive. 3M +39.59% shows momentum building, but 52W high $86.65 is still -18.4% away.
Physical switch: IAM ARR penetration rate. Hits 20%+ with margin stability = re-rating toward growth multiple. Stalls below 18% = 14x forward is fair, no catalyst.
$DOCU
$LULU -15.6% to $102.79. The "beat" is optical. Guidance slashed 60%.
1. Q2 EPS $2.92 vs $1.79 est — but $0.86 is tariff refund benefit. Strip it out: underlying EPS $2.06, real beat +15% not +63%
2. Revenue $2.42B missed $2.46B est. Comp sales -9% — worst in 3 years
3. Q3 EPS guide $0.93-$0.98 vs $2.40 est — a 60% haircut. FY26 EPS cut to $9.48-$9.73 vs $10.88 est
Gross margin 60.5% looks +200 bps YoY. But tariff refunds boosted it 560 bps. Underlying margin actually deteriorated ~360 bps. The quality of earnings is poor.
Forward PE 10.78x — cheapest since 2020. But cheap ≠ mispricing. Three-dimensional test:
• Moat: brand intact, GM still best-in-class apparel
• Expectation gap: DOWN — guidance slashed, fails condition
• Technical: -15.6% plunge, no reversal signal yet
Verdict: NOT a mispricing. Comp sales -9% is a demand problem, not a valuation problem. Fails the "expectation gap up" requirement. Burry holding and buying below $100 does not change the fundamentals — his $238 cost basis is deeply underwater.
Physical switch: Q3 comp sales trend. Stabilizes above -5% = accumulation zone. Deteriorates past -10% = structural consumer shift, avoid.
$LULU
NPO is the transition nobody's pricing. 3.2T bandwidth, 80% of module cost, 2027 mass production.
Channel check: former Tianfu PMC manager (8 years, production planning & supply chain).
3 data points:
1. NPO positioning: 4×800G optical engine mainstream, some 2×1.6T. 100mW CW sufficient. No unified standard — each vendor own design. NV doesn't self-develop NPO, buys from module makers. Used in scale-up domain; CPO currently in scale-out.
2. Pricing: ~20% cheaper than equivalent 3.2T modules (~$1,200-1,500). NPO FAU ~¥500-600/unit vs module FAU ~¥70/unit. Higher value capture per unit. NV buying NPO to address CSP resistance to expensive CPO.
3. CW light source tiering: 100/70mW not scarce ($4-5, annual decline 10-15%, margin 10-20%). Domestic 200mW in sampling (源杰). CPO needs 350-400mW — only Lumentum can make it. This is the real CPO bottleneck.
Timeline: 2027 H1 small batch, H2 mass production. Industry consensus: NPO runs smoothly → CPO follows naturally. NPO 2027 → CPO low-cost 2028.
Physical limit: NPO bandwidth can't reach 100T+ (CPO can). NPO is the volume product in 2027, not CPO.
$LITE $AVGO
$AVGO beat Q3. Classic beat but dump.
1. EPS $3.32 vs $3.22 est (+3.1%) — 5th consecutive double beat
2. Revenue $29.59B vs $29.24B est (+1.2%) — +85.5% YoY
3. AI semiconductor revenue $16.7B, +221% YoY — FY26 AI guide raised to $58B
Beat magnitude narrowing: EPS surprise +4.3% → +1.7% → +1.0% → +3.1% (last 4Q). Consensus catching up. "Surprise premium" fading.
GM 69.1%, OM 53.9%, OCF $14.2B. Forward PE 19.65x. Net Debt $35.4B. YTD +5.64%, 3M -12.33%.
The selloff is not fundamentals — it is positioning. 5 consecutive beats made AVGO the most crowded long in semis. "Not-good-enough" kills crowded trades.
But: AI revenue tripling YoY with FY26 guide raised to $58B. OCF $14.2B covers 40% of $59.4B total debt. Forward PE 19.65x for +85.5% YoY revenue growth.
Physical switch: AI revenue trajectory, not quarterly beat magnitude.
$AVGO
DELL Q2 FY27: Preview thesis confirmed.
DELL delivered a +43.4% EPS beat ($7.04 vs $4.91) and +4.6% revenue beat ($46.97B vs $44.89B). Shares +9.91% AH. The framework held: high bar requires big beat, DELL delivered a big beat.
1. ISG operating margin hit 15.0% (vs 8.8% YoY) — the physical switch flagged in the Preview. ISG operating income $4.78B (+225% YoY). AI server revenue $16.4B (+100%), traditional servers +122%, storage +26%. Broad-based, not just AI. (per Dell Q2 FY27 earnings release, 9/1)
2. AI server orders $60.9B (single quarter), backlog exited at $95.0B. FY27 AI server revenue guide raised from $60B to $74B (+200% YoY). Total FY27 revenue guide raised $25B to $192.0B. Q3 guide $49.0B vs $41.4B consensus. (per Dell Q2 FY27 earnings release, 9/1)
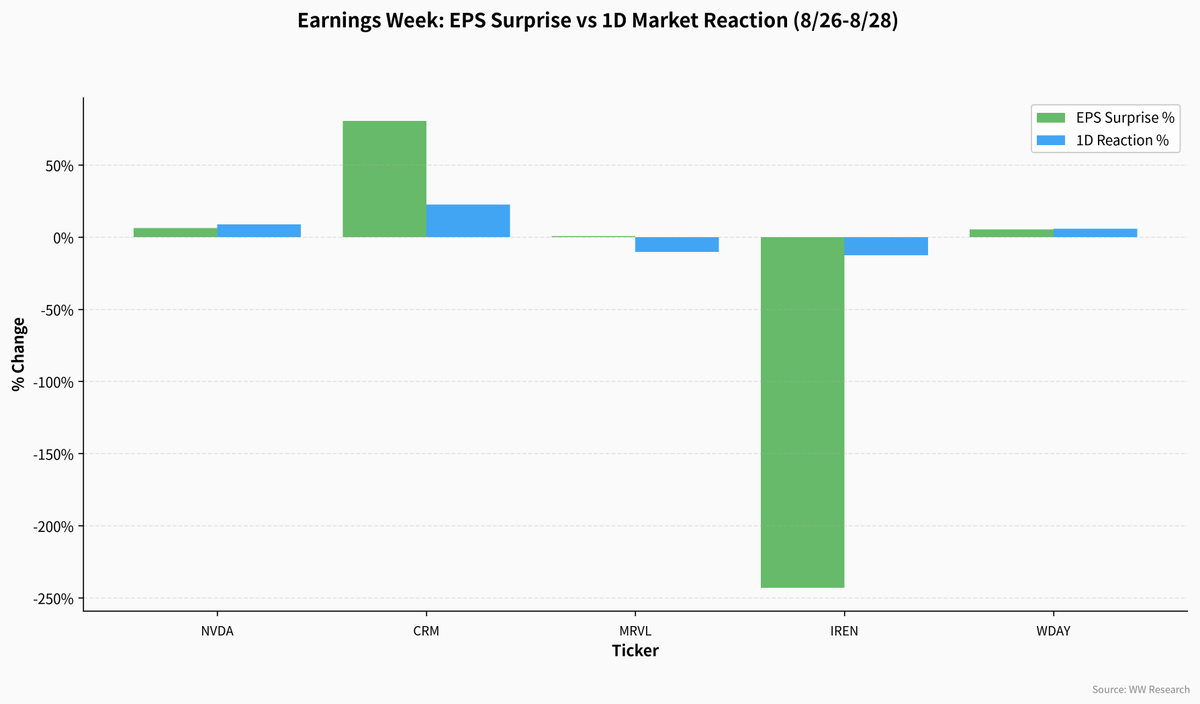
3. 5 consecutive EPS beats: Q2 FY26 +1.3% → Q3 FY26 +4.9% → Q4 FY26 +10.2% → Q1 FY27 +64.2% → Q2 FY27 +43.4%. Accelerating, not decelerating. MRVL delivered +0.6% and dropped -10.3%. Same framework, two outcomes.
4. Adjusted FCF $8.1B (+224% YoY). Capital return $4.3B (buybacks + dividends). OCF $2.2B. Cash $11.6B, total debt $34.5B. Balance sheet funds growth without credit risk.
My take: $95B backlog = 2x quarterly revenue. The question is not demand but conversion rate and margin sustainability. ISG 15.0% margin proves AI servers are not margin-dilutive at scale. Forward PE 24.6x (AH basis) for a company growing revenue 58% YoY with accelerating beats is reasonable.
Physical switch: ISG margin trajectory above 12% + AI backlog conversion rate + FY27 guide holds.
$DELL
$SNOW reports tomorrow night. The most expensive stock in software.
Forward PE 166.67x. P/B at 100th percentile — literally the most expensive it has ever been. YTD +52.94%. 6M +96.97%. Only -3.08% from 52w high.
5 consecutive EPS beats averaging +19.2%. But the bar is perfection.
3 things that matter:
1. Product revenue growth. MS channel checks show +34% YoY (vs guidance ~30%). If FY27 guide gets raised to +32-33% from 30.6%, the 168x PE gets validated. If not, it gets punished.
2. Cortex Code momentum. MS says AI revenue only 5-8% of a partner's business. Cortex Code appeared in ~1/3 of deals but momentum "flattened" since early 2026. Narrative says AI will save SNOW. Data says AI is barely moving the needle.
3. EPS revisions diverging. FY32/33 +11.27%/+11.19% (90d) — short end still up. But FY34/35 -5.68%/-6.61% (90d) — long end rolling over. The market is paying 168x for growth that is decelerating at the tail.
MS downgraded risk/reward to "less attractive." GAAP operating margin -23.7%. Net loss -$0.30B. Cash flow positive but not covering losses.
The setup: beat is priced in. Anything short of a blowout + raised guide triggers multiple compression from 168x. Asymmetric risk is downside.
$SNOW
200G EML is the tightest bottleneck in optical networking. Zero inventory. Assembled on arrival.
Channel check: former Tianfu PMC manager (2016-2024, 8 years running production planning & supply chain):
1. AVGO controls ~80% of 200G EML supply. Lumentum ~20%. But Lumentum capacity is locked by InnoLight — Tianfu tried buying Lumentum chips in Sep 2025, didn't get supply until Jun 2026 (9-month wait). Only got it because Mellanox intervened.
2. 200G EML price flat since last year. No increase, no decrease. 100G EML already oversupplied — annual price drop 15-20%, margin compressed to 10-20%. Supply-demand has reversed for legacy nodes.
3. EML demand peaks 2027, declines 2028. The physical switch: silicon photonics penetration. InnoLight at 40% now, breaking 50% in 2027, 60-70% by 2028. Domestic 200G samples already submitted — bottleneck is engineering precision and yield, not technology. Just a matter of time.
4. CW (100/70mW) not constrained — multiple suppliers. Price ~$4-5, annual decline 10-15%. But CPO needs 350-400mW — only Lumentum can make that.
The real risk to AVGO's optical moat: not competition, but silicon photonics eating EML demand from the top down.
$AVGO $LITE
$AVGO reports tomorrow night. The most asymmetric setup in semis right now.
RSI 26.2 — deeply oversold. -25.2% from $495 high. 5 consecutive EPS beats. Expectations reset hard.
3 things that matter:
1. THE number: FY27 AI revenue. Management guided $100B. Citi models $116B. Street expects $121-130B (down from $150B). Even a guide at $110-116B could rally the stock because expectations are already reset.
2. ASIC mix rising 38% → 44% compresses GM ~80bps (Citi). AI ASIC GM ~60-62% vs overall 67.8%. But Tomahawk 6 sold out through next year. 7 ASIC programs running: Google, Meta, OpenAI, Anthropic, ByteDance, SoftBank, SambaNova.
3. EPS revisions strong but flattening. FY28 +6.51% (90d) but only +0.23% (30d). 3M -23.1%. Forward PE 19.72x NTM. Citi TP $500 = 35% upside.
The bar is low. Goldman says expectations "muted." Citi models below Street. This is the opposite of DELL's high-bar setup.
Real risk is FY27 AI guide below $100B. Anything $110B+ likely rallies. Asymmetric: downside if <100B, upside if >110B. Risk/reward favors longs.
$AVGO
DELL reports tomorrow night. AVGO Wednesday. Both core AI infra holdings.
But the setups couldn't be more different:
DELL: NTM PE 25.7x, RSI 49.6, +257% YTD, 3 consecutive beats avg +26.4%. Goldman already at $4.96 vs $4.91 consensus. High bar.
AVGO: NTM PE 19.9x, RSI 23.5 — most oversold since 2024 bottom. -25.5% from 52w high. Bad news priced in.
$DELL — 3 things that matter:
1. ISG margin is the switch, not revenue. AI servers carry thin margins. Goldman expects EBIT margin 9.7% vs consensus 9.1%. Beat on margin = rally. Beat on revenue only = muted.
2. Supply (DRAM/NAND/CPU) caps upside, not demand. Citi: FY guide implies 1H strength + 2H prudence. JPM TP $565 = 24% upside.
3. Negative equity (-$2.47B), debt $31.5B vs cash $11.5B. EPS revisions trending up (FY28 +3.4% 90d, FY29 +5.0% 90d).
$AVGO — 3 things that matter:
1. THE number: FY27 AI revenue. Management guided $100B. Citi models $116B. Street expects $130B (down from $150B last quarter). The gap between $100B and $130B is where the risk lives.
2. ASIC mix rising 38%→44% compresses GM ~80bps (Citi). But Tomahawk 6 sold out through next year. 7 ASIC programs running.
3. EPS revisions strong (FY28 +6.5% 90d) but flattening 7d/30d. NTM PE 19.9x. Citi TP $500 = 36% upside.
My take: DELL's beat is priced in — reaction depends on margin guidance, not revenue. AVGO is the asymmetric setup: RSI 23.5 + expectations reset from $150B to $130B means even a $110-116B guide could rally the stock. Real risk is guide below $100B.