1/4 🚨 US Equities at Liquidity Wall
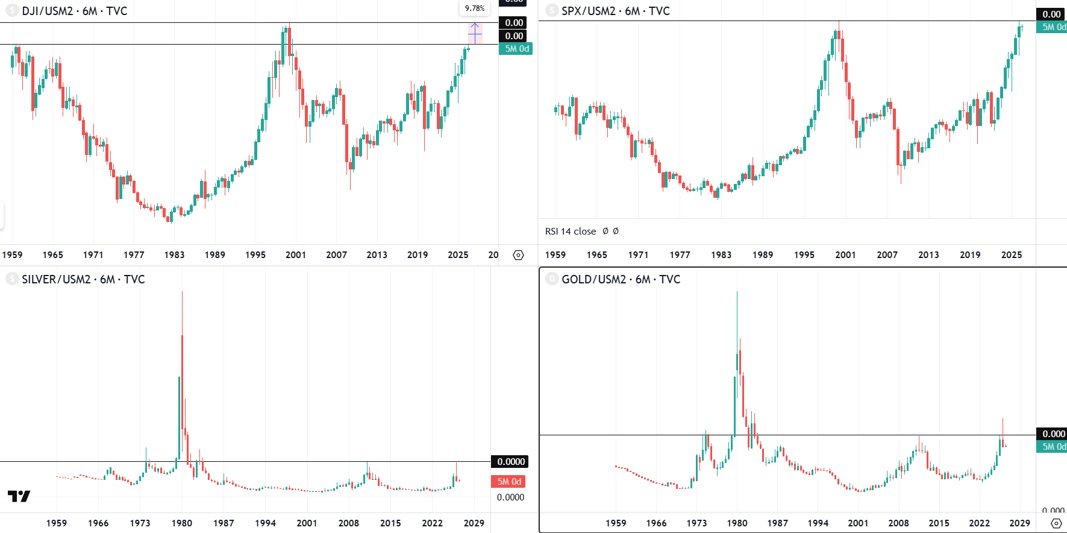
When you price $SPX against M2 liquidity, the index is pressing into the same multi‑decade resistance band that capped the Dot‑Com bubble top in 2000. $DJI still has ~9–10% buffer before hitting its ceiling, but the setup is similar.
Over a 60+ year timeframe, every test of this liquidity wall has triggered multi‑year drawdowns. Risk/reward here is deeply asymmetric — chasing nominal highs at this band has historically ended badly.
2/4 🪙 Gold & Silver at Ceilings
The same dynamic applies to metals when adjusted for M2. Look at the bottom panels: parabolic resistance ceilings have produced violent rejections.
• 2011: Silver collapsed ~72%, Gold corrected ~44% after hitting peak resistance.
• Jan 2026: Silver fell ~55%, Gold ~30% in just 7 months.
Liquidity ceilings don’t just cap equities — they punish hard assets too, showing how brutal these rejections can be when liquidity dries up.
3/4 📈 US 10‑Yr Yield Regime Shift
The 10‑Year Treasury Yield has broken a 40‑year secular downtrend intact since the early 1980s. This is not a minor move — it’s a structural regime change.
• Higher lows + an upward‑sloping 55 EMA confirm the trend reversal.
• With the downtrend broken, the long‑term chart target sits at 7.90% (~65% higher from current levels).
This is the first time in decades that yields are structurally rising, signaling the end of the “lower for longer” era.
4/4 💡 Strategic Allocation
When liquidity‑adjusted equities hit historical ceilings *and* interest rates exit a 40‑year bear market, sticking to the old playbook is dangerous.
• 🔻 US Equities: Trim exposure; avoid chasing highs at resistance.
• 🔄 Rethink allocation: Rising yields + liquidity walls = asymmetric risk.
The combination of stretched equities, capped metals, and a secular yield breakout suggests a regime shift. Positioning defensively now is about respecting history, not fighting it.
P.S. I am not a Sebi Registered Analysis. This is not a financial advice. Just how I’m reading the charts.
1/4 🚨 US Equities at Liquidity Wall
When you price $SPX against M2 liquidity, the index is pressing into the same multi‑decade resistance band that capped the Dot‑Com bubble top in 2000. $DJI still has ~9–10% buffer before hitting its ceiling, but the setup is similar.
Over a 60+ year timeframe, every test of this liquidity wall has triggered multi‑year drawdowns. Risk/reward here is deeply asymmetric — chasing nominal highs at this band has historically ended badly.
2/4 🪙 Gold & Silver at Ceilings
The same dynamic applies to metals when adjusted for M2. Look at the bottom panels: parabolic resistance ceilings have produced violent rejections.
• 2011: Silver collapsed ~72%, Gold corrected ~44% after hitting peak resistance.
• Jan 2026: Silver fell ~55%, Gold ~30% in just 7 months.
Liquidity ceilings don’t just cap equities — they punish hard assets too, showing how brutal these rejections can be when liquidity dries up.
3/4 📈 US 10‑Yr Yield Regime Shift
The 10‑Year Treasury Yield has broken a 40‑year secular downtrend intact since the early 1980s. This is not a minor move — it’s a structural regime change.
• Higher lows + an upward‑sloping 55 EMA confirm the trend reversal.
• With the downtrend broken, the long‑term chart target sits at 7.90% (~65% higher from current levels).
This is the first time in decades that yields are structurally rising, signaling the end of the “lower for longer” era.
4/4 💡 Strategic Allocation
When liquidity‑adjusted equities hit historical ceilings *and* interest rates exit a 40‑year bear market, sticking to the old playbook is dangerous.
• 🔻 US Equities: Trim exposure; avoid chasing highs at resistance.
• 🔄 Rethink allocation: Rising yields + liquidity walls = asymmetric risk.
The combination of stretched equities, capped metals, and a secular yield breakout suggests a regime shift. Positioning defensively now is about respecting history, not fighting it.
P.S. I am not a Sebi Registered Analysis. This is not a financial advice. Just how I’m reading the charts.
Nifty has gone absolutely nowhere for 2 years.
June 2024 to June 2026: flat. Zero.
Here's what happened every single time this occurred before:
Every 2-year flat patch in Nifty's history was followed by positive 1-year returns.
Without exception. Average: +24.8%.
The 3-year forward return after these stagnation phases? +62.2% on average.
That's a 17.3% CAGR.
The 5-year return? +107.2%.
Money more than doubled.
The market isn't broken. It's coiling.
When Nifty spends 2 years going sideways, earnings catch up to valuations.
The time correction builds the base.
Then the price correction resolves upward... as it always has.
History doesn't repeat. But it rhymes a lot.
#stockmarketindia
Source : Edelweiss
From the exact bottom call → now +17% in just 18 trading days.
The Right Shoulder is fully in play, confirming the relief rally.
#NiftyIT#TechnicalAnalysis#Markets#TradingView
https://t.co/AUfzOL5j1B
Is the Nifty IT index setting up the ultimate bull trap? 🧵👇
Value hunters are looking at a 16.9 PE close to Covid lows, but the monthly chart tells a dual story:
1️⃣ Short Term: A major Head & Shoulders relief rally is loading. Expect a dead-cat bounce targeting 32k (+25%) and potentially 38k (+50%) to print the Right Shoulder.
2️⃣ Long Term: This is a structural distribution phase. The ultimate target for this macro pattern sits at the lower channel support: 18k to 15k.
Enjoy the upcoming tactical bounce, but don't confuse a cyclical relief rally with structural safety.
Personal opinion only, not SEBI advice.#NiftyIT #PriceAction #Nifty #Trading
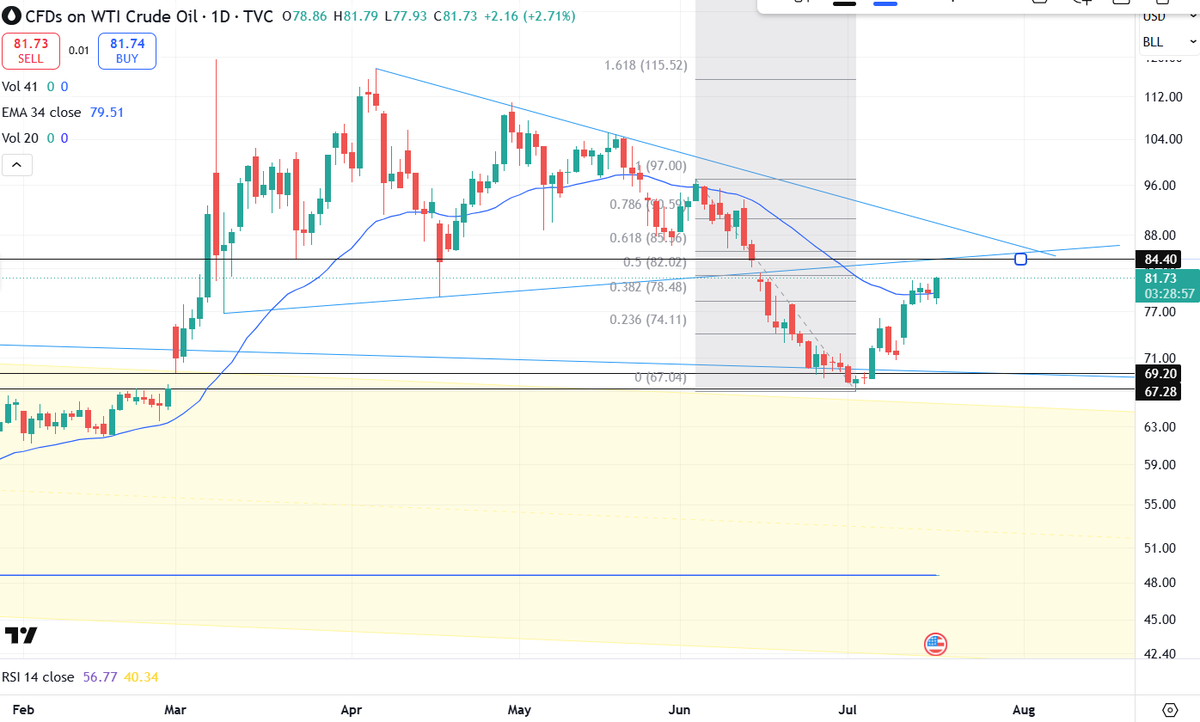
🛢️ Crude Oil – Resistance Confluence in Play 📉
Crude has rebounded strongly, but the rally is now pressing into a zone where multiple barriers converge — often the stage for a pause or reversal.
📐 Fibonacci Retracement: The 61.8% “golden ratio” sits near $85, a classic turning point in trending markets.
🔼 Rising Trendline Resistance: The broken triangle’s lower boundary now flips into resistance, aligning near $84.5.
➖ Horizontal Supply Zone: Around $84.4, crude has repeatedly faced selling pressure
Together, these levels form a **resistance cluster** where a pullback is expected
👉 A perfect case study in how combining Fibonacci, trendlines, and horizontal zones gives a fuller picture than any single tool.
#CrudeOil #WTI #TechnicalAnalysis #Fibonacci #PriceAction #Commodities
Still going gaga over defence stocks because a influencer told you it’s a "forever multi-bagger"? 🤡
Take a cold look at this quarterly chart. The index pulled off a vertical ~2,000% move over 6 years and 3 months. But look closer at the massive momentum breakdown.
While the price has crawled back up to desperately retest its highs, the 3M RSI is putting in a textbook bearish divergence by making a distinct lower high. The underlying buying exhaustion is screaming right at you on the chart, yet retail is still happily rushing in to provide exit liquidity.
Blindly following a rally while momentum fades isn’t investing—it’s surrendering to FOMO
#NiftyIndiaDefence #StocksToWatch #TechnicalAnalysis #DalalStreet
Is the Nifty IT index setting up the ultimate bull trap? 🧵👇
Value hunters are looking at a 16.9 PE close to Covid lows, but the monthly chart tells a dual story:
1️⃣ Short Term: A major Head & Shoulders relief rally is loading. Expect a dead-cat bounce targeting 32k (+25%) and potentially 38k (+50%) to print the Right Shoulder.
2️⃣ Long Term: This is a structural distribution phase. The ultimate target for this macro pattern sits at the lower channel support: 18k to 15k.
Enjoy the upcoming tactical bounce, but don't confuse a cyclical relief rally with structural safety.
Personal opinion only, not SEBI advice.#NiftyIT #PriceAction #Nifty #Trading
Nailed the absolute bottom on the exact day of the post! 🎯
Since then, the Nifty IT index has already surged over 7% straight off the lows. The daily Morning Star pattern and massive short-covering are playing out exactly like the tactical relief rally discussed.
The Right Shoulder structure is officially printing. There is still more juice left in this tactical bounce before we hit major structural resistance. Enjoy the ride, but keep your trailing stops tight. 📈
#NiftyIT #StockMarketIndia #PriceAction
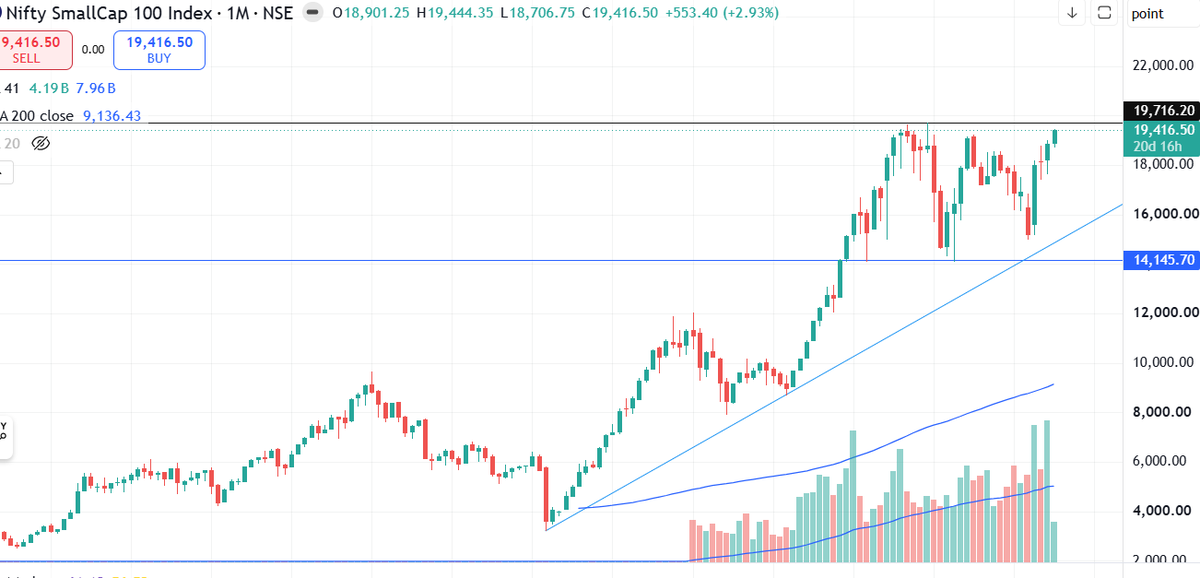
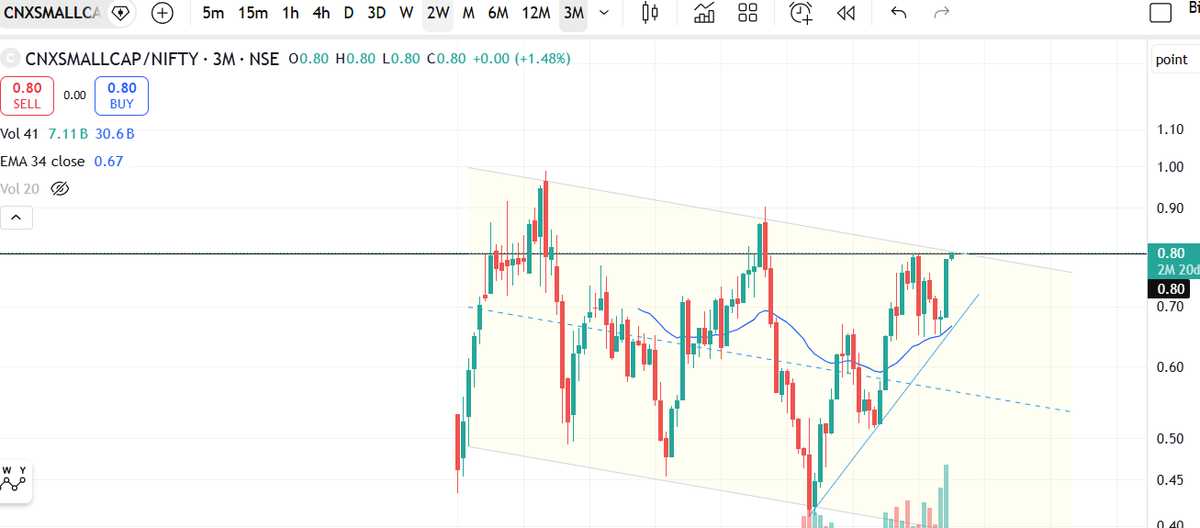
The crowd screaming "Nifty Small Cap Breakout" is walking into a classic trap.
🛑1️⃣ Index Chart: The Nifty Smallcap 100 is hitting heavy All-Time High resistance.
2️⃣ Ratio Chart: The CNXSMALLCAP/NIFTY ratio is simultaneously stuck under a massive, multi-year declining ceiling.
This isn't a fresh breakout zone—it’s a textbook profit-booking zone. The smart money is distribution-focused here while retail provides the liquidity. Don't FOMO at the top. 📉 #TechnicalAnalysis #NiftySmallcap #StockMarketIndia
@jainmitesh1985 Daily pr lgau to definitely it has been stopping at this value from Dec 24. Not sure aap konse time frame pr check kr rhe ho. But not sure usse targets 250 kaise aarhe h abhi. Happy to be enlightened..
Most investors rotate capital based on FOMO. The pros use math—specifically, the Nifty/Gold Ratio Chart shown below. Here is how to read this chart to outsmart macro cycles :👇
a) The Floor (1.40 - 1.65): When the ratio hits this bottom zone, equities are historically dirt cheap compared to Gold. Buying here triggered massive equity outperformance.
b) The Ceiling (3.60 - 4.15): When the ratio tests the top bands, equities are overvalued.
Stop guessing which asset class will run next or listening to narrative hype. Let the ratio chart strip away the noise and map your macro rotation.
Value meets price action in Healthcare: $KRSNAA 🩺📈
A multi-year Cup & Handle on the weekly chart flashes a structural bottom signal.
🚨 The Technical Alignment:
a) Double Bottom: Bouncing cleanly off the key structural floor at ₹528.
b) Fib Pocket: Resting near the high-confluence 78.6% Fibonacci retracement (~₹499) to exhaust sellers.
c) RSI Floor: Weekly RSI hits the identical oversold level as Nov 2022—the absolute low of the last cycle.
📊The Fundamental Perspective: Massive valuation divergence as price drops but earnings rise:
a) Lowest P/E since March 2023 (Industry trades at a premium 62x+).
b) Highest TTM EPS since August 2022, showing business efficiency.
🎯 Targets 90%+ upside over the next 24 months for a retest of the 1,034 peak in next 24 months
P.S. I am not a Sebi Registered Analyst
#TechnicalAnalysis #KRSNAA #NiftyHealthcare #ValueInvesting
Is the Nifty IT index setting up the ultimate bull trap? 🧵👇
Value hunters are looking at a 16.9 PE close to Covid lows, but the monthly chart tells a dual story:
1️⃣ Short Term: A major Head & Shoulders relief rally is loading. Expect a dead-cat bounce targeting 32k (+25%) and potentially 38k (+50%) to print the Right Shoulder.
2️⃣ Long Term: This is a structural distribution phase. The ultimate target for this macro pattern sits at the lower channel support: 18k to 15k.
Enjoy the upcoming tactical bounce, but don't confuse a cyclical relief rally with structural safety.
Personal opinion only, not SEBI advice.#NiftyIT #PriceAction #Nifty #Trading
Is #JubilantFoodworks finally setting up for a massive turnaround? 🍕📊
1️⃣ 55% price correction over the last 4.5 years
2️⃣ Current PE at 67 vs 10-year median PE of 106
3️⃣ 3-year divergence: Highest EPS vs lowest PE
4️⃣ Forming a clear bullish divergence on the weekly timeframe
Can it bottom around the 380-390 zone? Nevertheless, looks like a great time to gradually accumulate for the long term.
First Target: 800 Duration : 18 -24 months 📈
#BottomFishing #Nifty #StockMarketIndia #JUBLFOOD