This rally is being driven by forced buying.
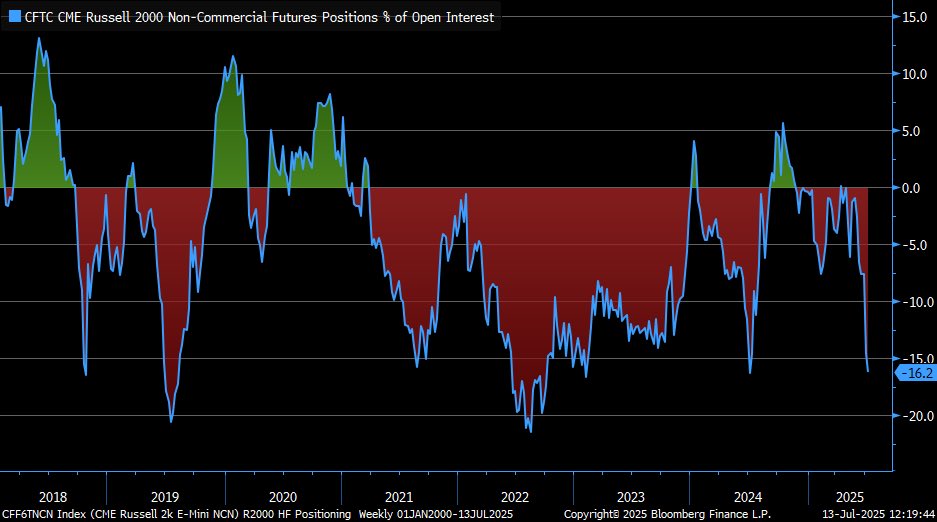
Hedgies were short.
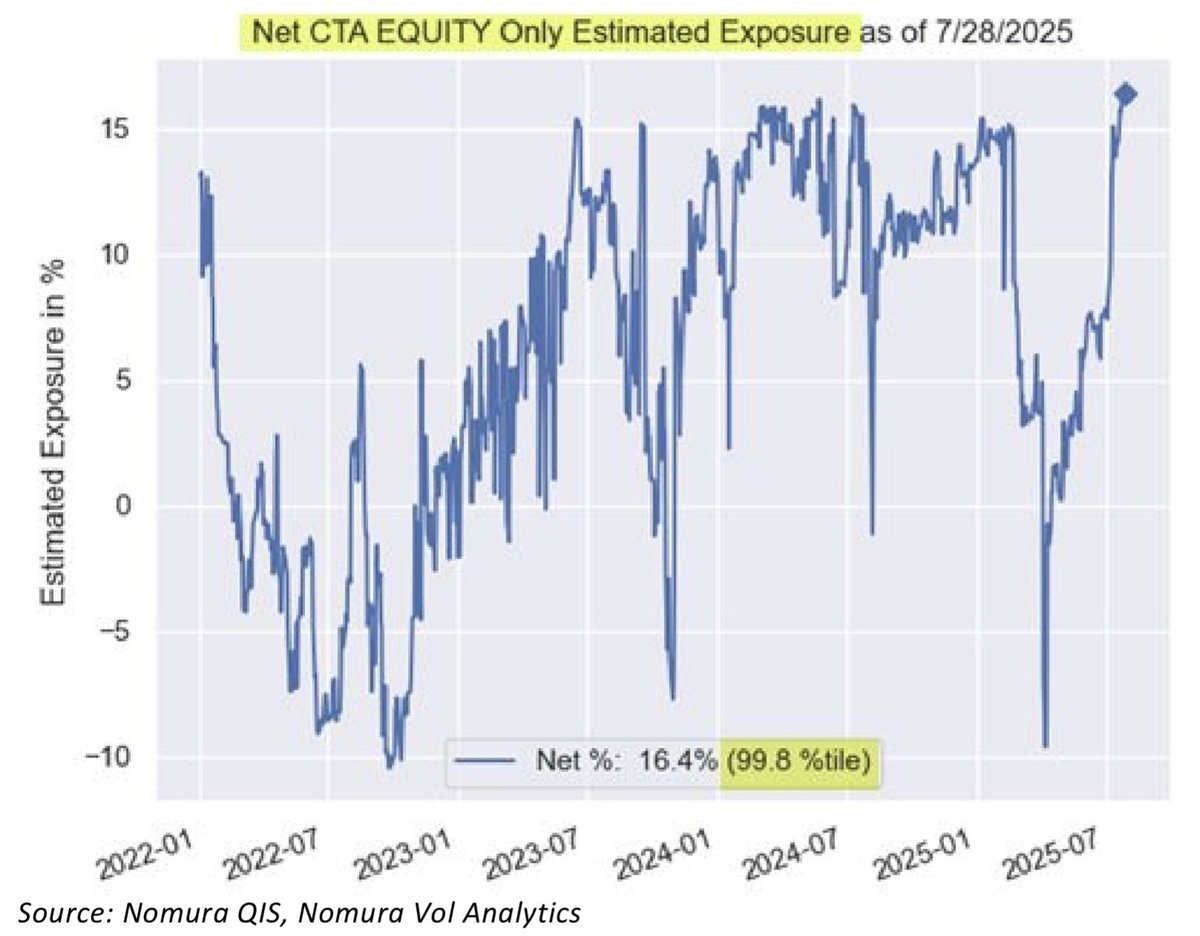
CTAs are being forced back in.
It’s not people buying because they want to. It’s buying because they’re forced to.
If the news flow deteriorates, the same people will have to sell it again.
So the question is what happens when the flow stops.
You’re not only trading market direction but instead this is more trading positioning.
This is not where you want to be short gamma.
I see it as:
Deal gets done: market keeps ripping.
Deal fails: market sells off.
Supportive flows are fading.
Event risk is rising.
Do I want to be running short gamma into the weekend with Monday's straddle priced at less than 1%. Probably not.
This is exposure to uncertainty, not a view.
A sharp re-correlation event is likely ahead:
In a healthy market, stocks tend to move together, either expanding breadth on the upside or compressing together on the downside. When large numbers of stocks simultaneously register extreme strength and extreme weakness, the market is signaling internal contradiction. This is investors disagreeing sharply about direction. This type of fractured structure has historically preceded turbulence, because markets rarely sustain contradictory internals for long. Eventually the tension resolves into a more uniform trend, and that shift often arrives with elevated volatility.
Fosback’s High–Low Logic Index quantifies this contradiction by measuring the share of stocks making new 52wk highs and new 52wk lows at the same time. Elevated HLLI readings indicate that the internal structure of the market is inconsistent with a stable trend. Too many stocks are behaving as if conditions are exceptional, but in opposite directions. Spikes in the indicator have repeatedly aligned with subsequent periods of negative returns and rising volatility, reflecting the market’s need to reconcile these mixed signals.
Return dispersion captures the same fragility from a return-based perspective. When individual stocks experience exceptionally large moves while the index barely changes, it indicates correlations have broken down and the cross‑section of returns has become disorderly. Extreme dispersion shows that capital is being pulled in opposing directions, precisely the dynamic highlighted by a high HLLI. The index becomes a misleading anchor, appearing calm while hidden instability builds underneath. Historically, such periods have been transitional, giving way to broad, correlated moves once a dominant macro driver emerges.
The LPPL framework fits naturally into this environment, as it mathematically identifies bubble-type price dynamics marked by accelerating, oscillatory behavior that cannot persist. The model detects “bubble exhaustion,” where prices have risen in a self-reinforcing pattern that becomes unstable, and “crash exhaustion,” where downside spirals have similarly run too far. Current LPPL readings show a market split between sectors exhibiting bubble-like upside exhaustion and others showing crash-like downside exhaustion. This mix reflects nonlinear dynamics characteristic of late-cycle instability and suggests that several sectors sit at mathematically unsustainable endpoints.
What ties LPPL signals to HLLI and dispersion is that all three frameworks diagnose instability rather than predict direction. LPPL captures instability in price patterns, HLLI in breadth, and dispersion in cross‑sectional returns. When all three light up simultaneously, they collectively describe a market stretched across conflicting pressures. This is the hallmark of late-cycle fragmentation, when internal relationships break down and sector behavior becomes desynchronized.
Taken together, the data materially increases the likelihood that correlations will snap back toward 1. A fractured state cannot sustain itself, and once the market resolves these contradictions, stocks tend to move together sharply. LPPL indicates that several sectors have reached unstable extremes, HLLI shows abnormal simultaneous highs and lows, and dispersion confirms extreme disagreement across stocks. Together, they portray a market approaching a phase transition.
Historically, when these conditions align, the resulting correlation spike is often asymmetric to the downside, as bubble exhaustion in defensives and cyclicals collides with crash exhaustion in growth and rate‑sensitive sectors. But regardless of the direction, the key takeaway is that diversification tends to evaporate at precisely the moment investors rely on it most. Correlations rise abruptly, idiosyncratic dispersion collapses, and the market resolves its internal conflict through a broad, unified move.
ht:
@TheMarketStats (High-Low Logic Index)
@VrntPerception (LPPL Chart)
Nomura (Dispersion)
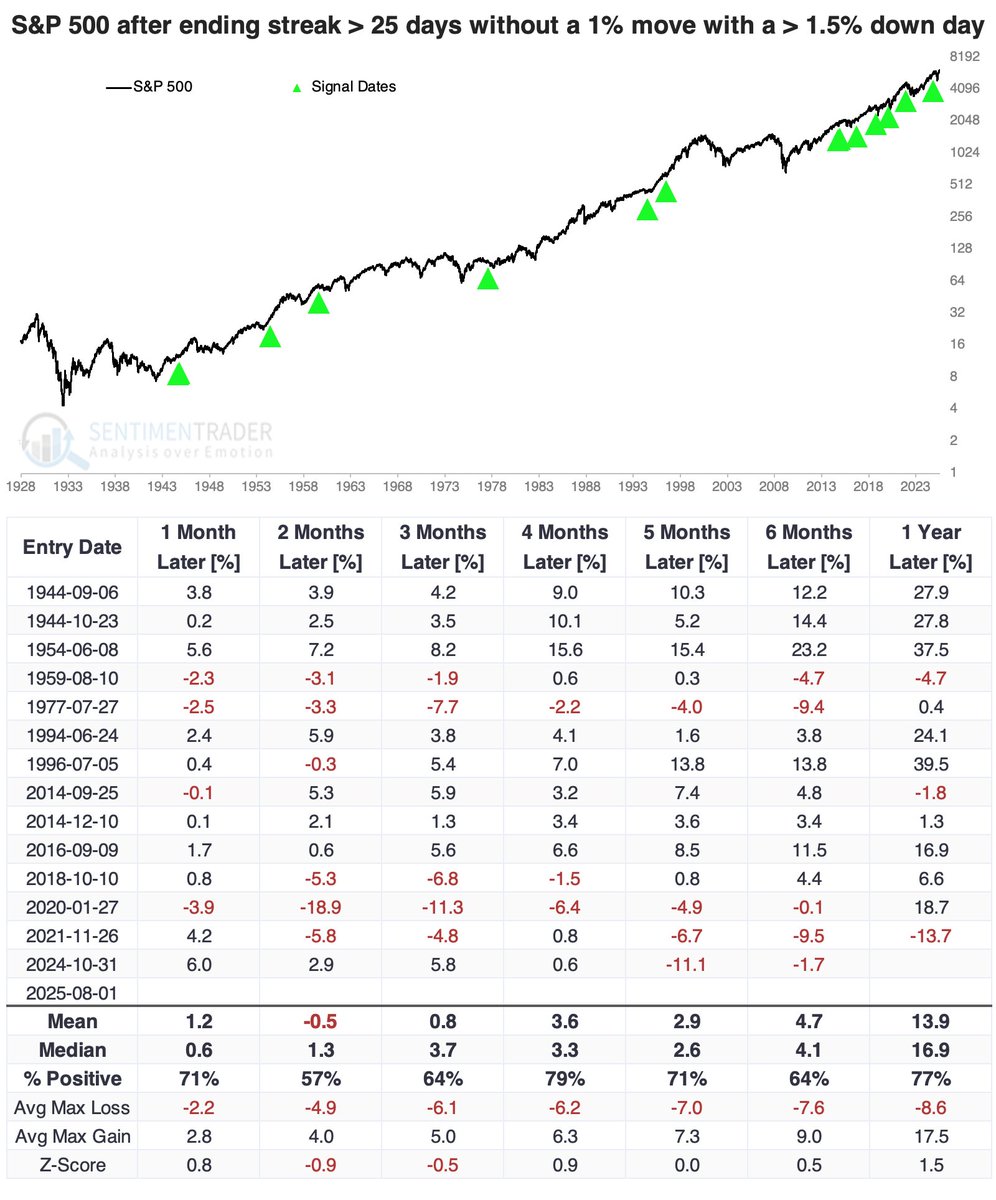
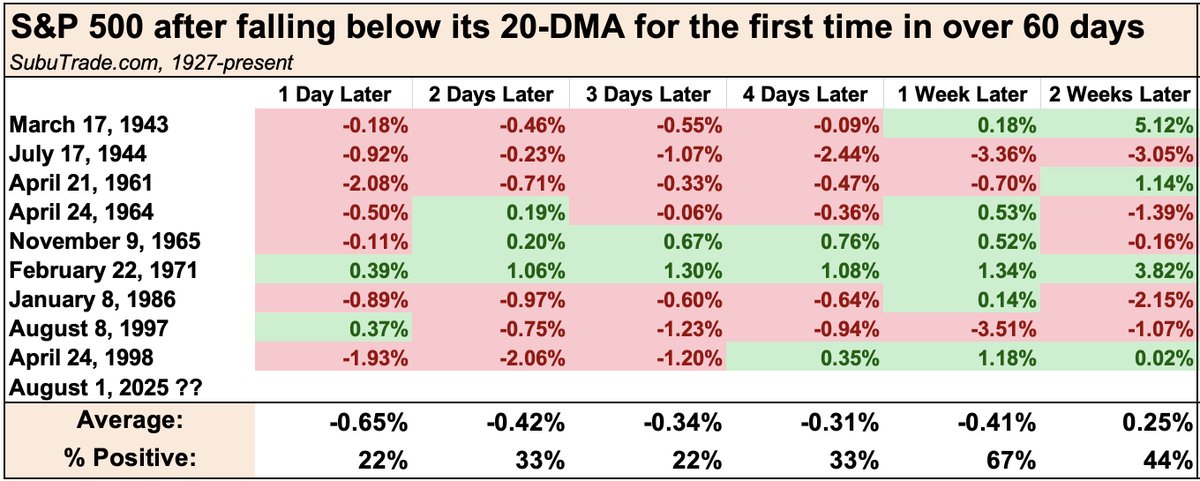
The S&P 500 ended its streak without a 1% move with a big, fat thud.
Prior to 2018, no big deal.
Since then, all four signals saw the S&P drop > 12% at some point within the next 6 months.
Large speculators/hedge funds most net short Russell 2000 futures since mid-2024 … getting closer to max net short positioning seen in 2022 bear market
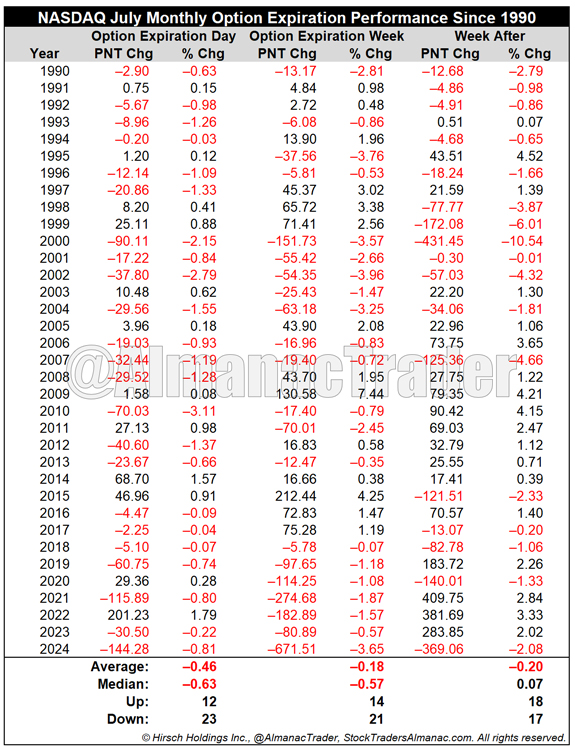
NASDAQ down 7 straight during July monthly options expiration week. NASDAQ also bearish on monthly options expiration day, down 23 of last 35, avg loss 0.46%. https://t.co/VrOgEyV2lU
Wary Positioning Leaves Room for S&P 500 to Rally [Bloomberg]
“While stocks have roared back, big money managers remain remarkably underweight: equity positioning has been lower only 23% of the time since 2010, according to DB.”
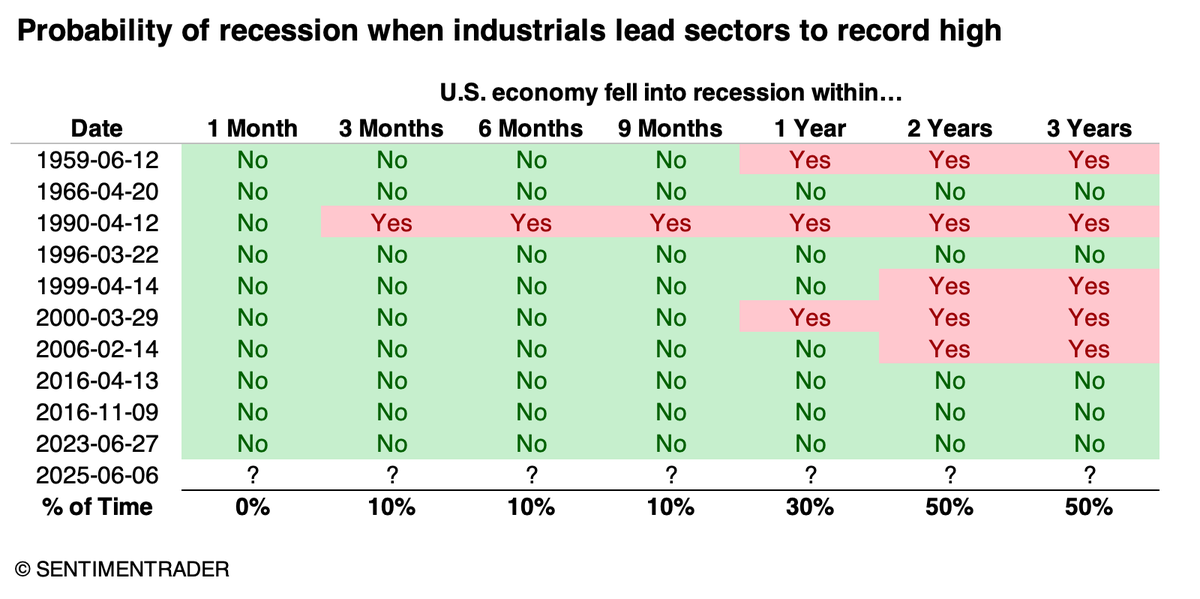
One sector has reached a record high, and it should be a good one.
Among major S&P 500 sectors, industrials are the first to power to a new high. This is supposed to be a good sign...and it is.
When industrials led, the U.S. fell into a recession only once within the following nine months. However, two more instances were added within a few months after that.
🔗 Read @jasongoepfert's Jun 9 article "An industrial strength rally": https://t.co/EmGxr32am0


![MacroCharts's tweet photo. Wary Positioning Leaves Room for S&P 500 to Rally [Bloomberg]
“While stocks have roared back, big money managers remain remarkably underweight: equity positioning has been lower only 23% of the time since 2010, according to DB.”](https://pbs.twimg.com/media/GtJ_dOFWgAAWMTs.png)