48-hour printer with Wizard of Alpha🧙♂️
Founder with 9 years of experience 🪨
Dominator in aggressive scalping 🎯
I would turn these guys into machines 🔮
#CryptoCommunity#TradingCommunity
One of our beginner Wizard members claims to have made 10x with our free indicator 👇🏼
https://t.co/v4bOcdZqPp
An example of honorable success.
#CryptoEducation#TradingLife
New Legendary & Free Indicator
In trading, forget the easy way
embrace the challenge
Education: A Lifelong Battle
In difficulty, a light of ease
No financial advice
A candle that illuminates 🕯️
https://t.co/v4bOcdZqPp
One of the most advanced Volume Profile indicators on TradingView, free for everyone, created by a trader for traders, made good use, peace 🧙♂️
https://t.co/cYMT4xmf7h
#CryptoMarkets
#BITCOIN TECHNICAL ANALYSIS 🪙
The chart shows a dominant downtrend since the 2025 highs (likely around $120k+ based on the visible levels). The price is currently trading around $63,000 - $65,000 (current level ~$63,078 at the time of capture). Key chart points: Overall structure: Clear downtrend with bearish swings. The price has broken several support levels and is now testing lower value areas.
Main Order Blocks (OB): OB 613.32K (74% Touched): Major support touched at the bottom of the chart, potential accumulation zone (green/red bar at the bottom).
OB 413.99K (95% Fresh): Higher fresh level, potential resistance.
OB 220.36K (76% Fresh) and OB 278.21K (81% Fresh): Border zones with partial mitigation.
OB 329.9K (80% Mitigated): Upper mitigated resistance.
Market Profile: POC (Point of Control) at ~$83,769: Historical maximum volume level, strong resistance (price well below → distribution).
VAL (Value Area Low) at ~$65,133: Lower limit of the value area. The price has been testing/rejecting it recently → critical zone.
Current Price: Just above the VAL and near the bottom of the recent range. The volume profile shows consolidation with marked bearish wicks (aggressive rejections).
Technical Scenarios: Bullish (rebound): Hold above 61-63k (OB touched + VAL). Retest the POC or fresh OBs around 70-80k if there is a bullish breakout. Increasing volume and a close above the VAL would be confirmatory. Short-term target: 70-75k.
Bearish (continuation): Break below 61k/OB 613k → acceleration towards 55-58k (next support levels). The downtrend remains intact as long as the price is below the upper mitigated OBs.
Implicit indicators: Price below long moving averages (weak trend), high volatility with large swings.
TA Conclusion: Market in a capitulation/low consolidation phase. The price is in a low value (discount) zone with potentially defensive OBs around 61-65k. Risk of a false breakout, but setup for a rebound if buying volume returns.
1D Timeframe: monitor the weekly/monthly close for confirmation.
Fundamental Analysis: Overall Sentiment, On-Chain & News (early June 2026).
The crypto market is in a post-2025 correction phase after an all-time high likely around 120k+ at the end of 2025. BTC has fallen by ~40-50% from its peaks, which is less severe than classic bear markets (the usual 75-85%), thanks to institutional adoption. Overall Sentiment: Mixed to Cautious: High FUD (Fear, Uncertainty, and Doubt) regarding ETF outflows, sales by whales/corporates (e.g., Strategy), and macro uncertainties (geopolitical, inflation). Many see a cyclical bottom forming (June-October 2026 aligned with halving cycles).
Institutional: ETFs have seen record outflows recently, but long-term holders (ETFs, corporates, sovereigns) are patient and have not capitulated en masse. High BTC dominance.
On-Chain Data (Key): Accumulation: Whales/dolphins have slowed, but some are accumulating on dips (spikes >100k). Long-term holders (LTHs) are very convinced, supplying at all-time highs.
Realized Price ~61k → strong structural support.
MVRV/Z-Score: Undervalued levels (MVRV ~1.4), similar to cyclical bottoms without prior excessive euphoria.
Other: Exchange outflows are positive at times, miners are accumulating (no massive dump), network activity is stable/consolidating. No signs of extreme smart money distribution.
RHODL/SOPR: Signals of a potential bottom (limited capitulation).
News & Macro Drivers: Selling pressure: ETF outflows, slowing whale accumulation, correlation with equities.
Structural Positives: Increasing adoption (ETFs, corporates), halving completed, transition to mature macro assets (smaller drawdowns). 2026 Forecast: 70-100k+ possible if liquidity returns.
Risks: Macro (interest rates, geopolitics), regulation, rotation towards stablecoins.
Fundamental Conclusion: BTC is in a potential accumulation zone with solid fundamentals (resilient institutions + on-chain). The cycle is not over; we are probably near a local bottom (or mid-cycle correction). Negative sentiment often offers good entry opportunities for HODLers. Downside risk persists in the short term, but an asymmetric upside is possible over 6-12 months if the macro improves.
Summary: TA shows critical support to test; FA suggests patience/accumulation. No financial advice – DYOR and manage risk. Monitor OB Daily and in case of a break here = 61k and ETF inflows for the next move!
@saylor@I_Am_The_ICT
Amazing, another Wizard indicator published, free for everyone to use ✨️
Professional indicators created by a real trader, no fluff, only the best by @Wizard_Of_Alpha
Just won this NFT without spending a single dollar!
Got it entirely with points I earned from staking my Wizards. Love being part of a community that rewards its members like this.
Thank you @Wizard_Of_Alpha
The Wizard family is becoming formidable.
NFT whales that trade better than traders
Guys who survived all the crashes & bullrun
Beginners who have acquired solid experience
Developers who build something every day
A Diamondhand NFT Solana community
Patience is for the strong Trader Wizard 🧙♂️
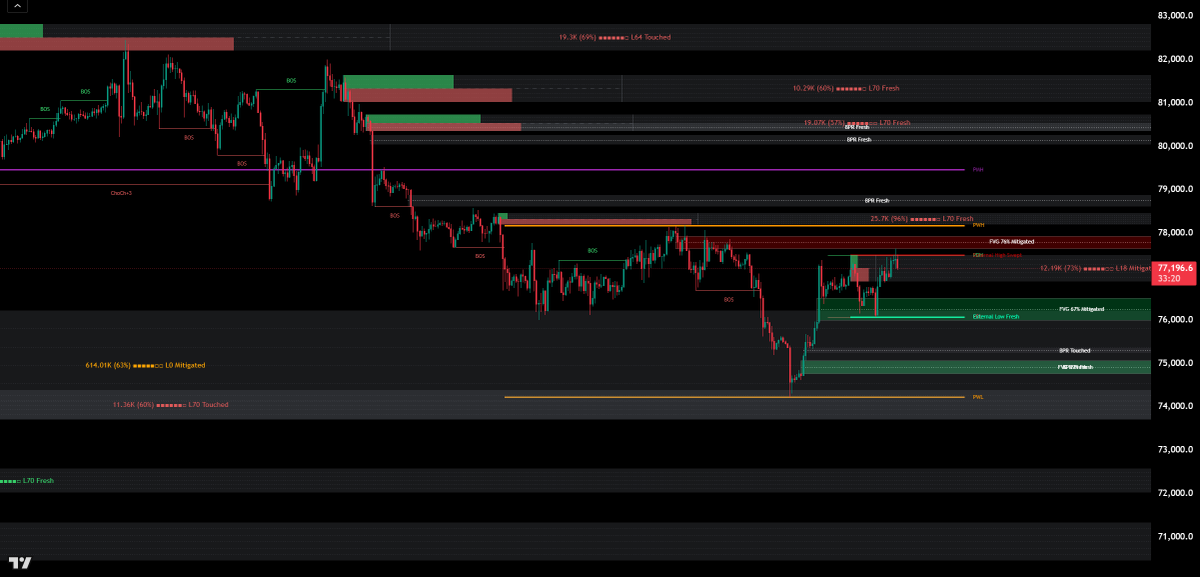
#BTC/USDT Technical Analysis
Timeframe H4
Type (ICT/SMC)
Overall structure visible on the H4 chart:
The chart shows a recent dominant bearish trend after a bullish distribution move higher (around 82-83k).
Several marked bearish Break of Structure (BOS) are visible, with clearly identified Order Blocks (OB) and Fair Value Gaps (FVG):
1-Day MTF OB (yellow/pink): Several institutional liquidity zones on the daily chart are affected or mitigated.
H4 OB (green/red): The green (bullish) and red (bearish) blocks show clear reaction zones.
H4 FVG (green/red): Many mitigated gaps (76% / 67% mitigated), indicating that the price has already filled a significant portion of the inefficiencies.
Current key points on the chart:
Price is rebounding from a low around 74-75k (PWL + External Low Fresh + mixed FVG).
Latest move: slight consolidation with a recent bullish BOS, but still below several OB/FVG resistance levels.
Strong psychological level: 77,196
Timeframe (end of May 2026: 6 days remaining)
Daily/Weekly: The overall structure remains in a correction phase after a broader bullish run.
May is generally neutral to slightly bearish (price around 77k vs. previous highs >80k).
End of the month: Often a rebalancing/profit-taking period.
With only 6 days remaining, there is a risk of increased volatility (possible squeeze).
Macroeconomic outlook: No obvious major catalysts this week, but monitoring of institutional flows and the DXY (Dollar Index).
Expected Bullish Scenarios (Swing/Continuation)
The current rebound from the lows shows strength (FVG 67% mitigated + External Low Fresh).
Targets: 78,000 – 78,500 (H4 OB + Unmitigated FVG)
79,000 – 80,000 (1D MTF Confluence Zone + L70 Fresh)
Extension: 82k if a clear breakout occurs above the bearish OB.
Bearish Scenarios (Continuation of Correction)
If the price loses the current support (~76,500 – 76,800), we will retest the recent lows.
Targets: 75,000 – 74,000 (PWL + Large FVG)
Extension: 72-73k (Lower liquidity zone).
Possible Trades (H4) Scalp (intraday / a few hours) Long: Rebound on fresh OB/FVG around 76,800 – 77,000 with a stop below the last low. Quick TP 77,800 – 78,200.
Short: Rejection at resistance red OB / mitigated FVG around 77,800 – 78,200. Stop above, TP around 76,500.
Swing (several days – end of week / month)
Preference for a cautious long bias as long as the price holds above 76,000-76,500.
Wait for confirmation of a clear bullish BOS on the H4 + successful retest of a green OB. Very favorable risk/reward if entered on FVG mitigation. Levels to monitor very closely: Support: 76,500 | 75,000 | 74,000
Resistance: 78,000 | 79,000 | 80,000 (critical zone)
Summary & Current Bias: Bias:
Neutral to slightly bullish in the short term on the H4 timeframe thanks to the ongoing rebound and mixed FVG. However, the overall structure remains bearish until the recent highs around 78-80k are clearly broken. The end of the month combined with low liquidity could trigger a fakeout in either direction. Risk management should be the priority.
#cryptocurrency #tradingTips
The most robust ICT script available, 6300 lines of code, no repainting required, fully configurable, technical and educational, prioritizing education and independence from simplistic signals sold by incompetent gurus.
https://t.co/J8hMjrNPdz


![Wizard_Of_Alpha's tweet photo. New Indicator Availble [Free] 🧙♂️
https://t.co/ZErHbPDGHG https://t.co/X1tOZr526W](https://pbs.twimg.com/media/HJa18vWWoAEq8Xl.jpg)