Indonesia - demo dan eskalasi di berbagai daerah
Inggris - ketegangan masalah imigran dan diversity
Amerika Serikat - isu Trump meninggal (tapi tadi malam sudah diklarifikasi, masih aman)
Jerman dan beberapa negara Eropa - menyuruh warga negaranya meninggalkan Iran
Yaman - Perdana menteri dibunuh Israel
Dunia ini kacau braaaayyy
GIVEAWAY $100k USDT TRADING FUND FOR 1000 TRADERs
- Setiap orang akan dapat $100 trading fund
- Profit dari trading dapet di withdraw
Syarat Join :
- Daftar Kucoin dengan link ini https://t.co/l45JchukOu
( CX8TH283 )
- Deposit minimal $1
- Quote postingan ini dengan #KucoinwithDon
- Setelah itu kirim bukti ke group https://t.co/I7gn2vBlge
- Lalu akan di invite ke group private trading with Don
Pendaftaran terakhir tanggal 24 July 2025
Event by @KuCoinFutures & Don Carlito
*Info detail di chanel telegram saya
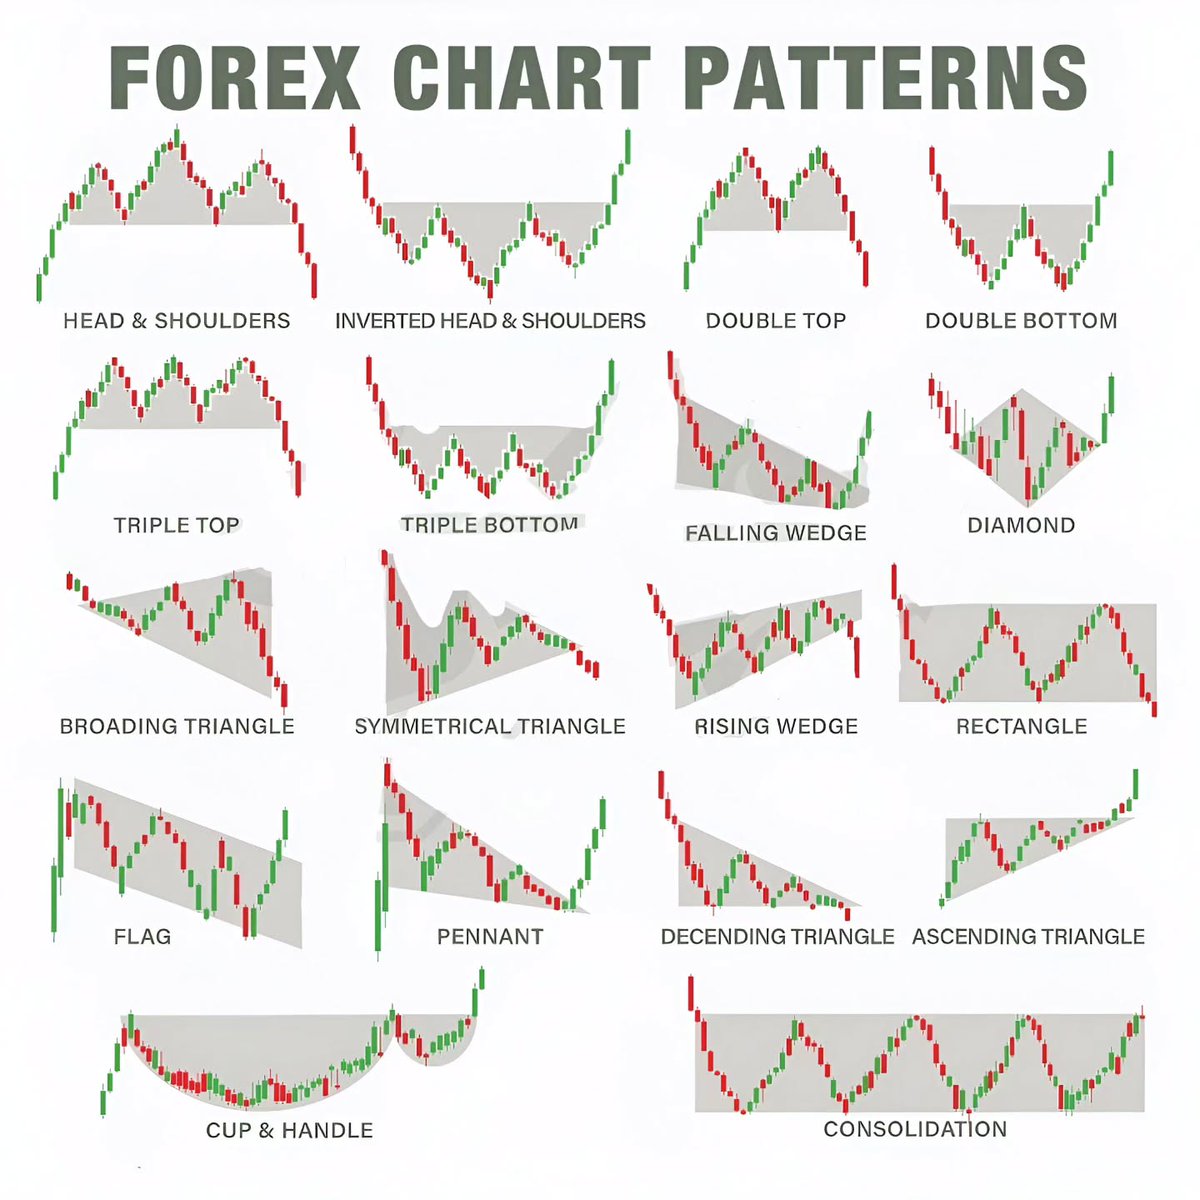
Reversal Chart Patterns
Reversal patterns happen when a chart has a strong break from its current trend and its momentum reverses course. This can happen on a trend line break of resistance or support out of a price range, a gap in price, or a long wick candlestick that changes direction and reverses off of highs in an uptrend or lows in a downtrend.
A reversal shows that buyers have lost control of an uptrend or sellers have lost control of a downtrend and price is no longer moving in the previous trend. This is a change in the path of least resistance.
Here are four of the most common chart patterns that show a reversal pattern on a chart:
•Double Top
•Double Bottom
•Head and Shoulders top
•Head and Shoulders bottom
•Rising Wedge
•Falling Wedge