كيف تعرف حجم العقود المفتوحة على أي أصل في تريدنق فيو
عقود الكول 🟢🐂 VS عقود البوت 🔴🐻
أداة بسيطة تس��عدك تحدد ميول السوق والاتجاه المتوقع في تاريخ معين.
الخطوات 👇
1️⃣ افتح علامة تبويب جديدة
2️⃣ اختر «الخيارات» (Options)
3️⃣ روح لـ «حجم التداول» (Volume)
4️⃣ بسعر التنفيذ (By Strike)
5️⃣ حدد التاريخ
6️⃣ اختر الأصل
شوف الفيديو المرفق 🎥 وطبّقها خطوة بخطوة
I spent 2 hours of my Saturday reviewing hundreds of charts. These are the setups that stood out and what you should focus on this week.
Software is starting to wake up. Semiconductors are taking a breather. The next rotation may already be underway.
$MSFT finally broke out.
$NBIS is setting up near a key trigger.
$PANW $CRWD earnings could be one of the most important software reports of the week.
Here’s the watchlist and recording:
$SPX: Strong week overall. Thursday breakout above 7517 held. Friday was indecisive. Above 7600 opens continuation. Failure there could mean a pullback toward 7550–7500.
$QQQ: Similar setup to SPX. Still leading higher but extended from the 9-day. Above Friday highs keeps momentum intact.
$IWM: Still trapped in a range between 287 and 293. Less clear than SPX and QQQ. Watching for either a breakout or rotation into small caps.
$BTC: No trade for now. All major moving averages remain stacked bearishly. Needs reclaim of the 200-day around 80k.
$SMH: Momentum has slowed. Four straight days of consolidation. Software may be attracting capital away from semis short term.
$IGV: One of the most important charts right now. Closed above the 200-day for the first time since January. Holding 100 would be very bullish.
$AAPL: Continues to surprise. Every dip gets bought. 310 remains the key level. Below that opens a test of the 9-day around 306.
$MSFT: One of the strongest setups on the board. Broke above 433 and 442. Looking for continuation toward the 200-day near 458 and eventually gap-fill toward 480.
$NVDA: Ugly close Friday. Failed reclaim of the 9-day. Better opportunities elsewhere for now. Watching 200 below.
$GOOGL: Weak close. Could test the earnings gap near 365. Hands off until strength returns above 385.
$AMZN: Failed breakout attempt. Still above key moving averages. Above 275 opens ATHs and potentially 300.
$TSLA: Building a range. 450–453 is the key breakout area. Above that could trigger a move toward prior highs.
$META: Friday was a healthy backtest of the breakout. Above 633 then 645 opens gap-fill potential higher.
$AMD: Strong but consolidating. Range here would be healthy after the recent move.
$AVGO: Earnings next week. Looking constructive. Above 500 becomes interesting.
$SMCI: Strong sympathy move from $DELL earnings. Watching to see if momentum can continue.
$QCOM: Failed breakout Friday. Give it time. Watching for renewed strength early in the month.
$ARM: One of the strongest semis. Above 356 keeps the trend intact.
$INTC: Failed multiple breakout attempts at 125. Consolidation remains constructive.
$MU: Strong finish Friday. Holding 960 and reclaiming 980 could open the path toward 1000.
$SNDK: Constructive close. Watching 1700 closely.
$DELL: Huge earnings move. Now trading inside an earnings range. Break above 430 opens more upside.
$NOW: Continues to show strong relative strength. Above 126 could open 150.
$IBM: Strong breakout. Watching above 300.
$ORCL: Massive momentum shift. Broke the 200-day and exploded higher. One of the stronger enterprise software names right now.
$PLTR: Improving. Watching for reclaim and hold above the 200-day.
$IREN: Large flag pattern. Above 76–77 could trigger a move toward highs.
$ZS: Ugly earnings reaction but trying to recover.
$CRWD: Earnings this week. Strong run into the report.
$NBIS: One of my favorite setups. Above 233–234 could trigger a significant move.
$PANW: Earnings this week. Looking extremely strong.
$NET: Recovering sharply after a terrible earnings reaction. Short covering continues.
$RDDT: Looking better. Momentum name worth watching.
$DDOG: One of the strongest software charts. Earnings gap never filled. Trend remains intact.
$FSLR: Solar leadership continues. Above 260 could open 300.
$ENPH: Vertical momentum. Watching for continuation.
$LITE: Still under pressure. Needs time.
$AXTI: Similar to LITE. Momentum has cooled.
Overall theme:
Software is showing the strongest improvement in relative strength.
Semiconductors are consolidating after a huge run.
Individual names continue to offer better opportunities than the indices.
$MSFT, $NBIS, $PANW, $ORCL, and $NET are some of my favorite charts going into next week.
President Trump quite literally just gave you a guide how to become rich off the stock market in 2026…
Last time he did this was with:
~ $INTC at $19 which ran +595% to $132+
~ $DELL at $230 which ran +96% to $451+
Now he’s telling you to buy these 3 stocks.
$NOW at $124
$PLTR at $156
$IBM at $297
Don’t miss these next runners…
I’ll say this one last time: these 10 companies will mint millionaires by 2030.
My top picks for May:
1. $SATL(Satellogic) — $10 → $16 2.
2. $IREN(Iren) — $64 → $120 3.
3. $ASTS(AST Spacemobile) — $126 → $320 4.
4. $RKLB(Rocket Lab) — $146 → $210 5.
5. $NBIS(NEBIUS) — $226 → $375 6.
6. $NOK(Nokia) — $15 → $24 7.
7. $USAR(USA Rare Earth) — $27 → $43 8.
8. $LUNR(Intuitive Machines) — $42 → $74 9.
9. $BKSY(BlackSky) — $51 → $78 10.
10. $NOW(ServiceNow) — $100 → $180 Come back to this post at the end of 2026, & you’ll thank yourself that you listened…
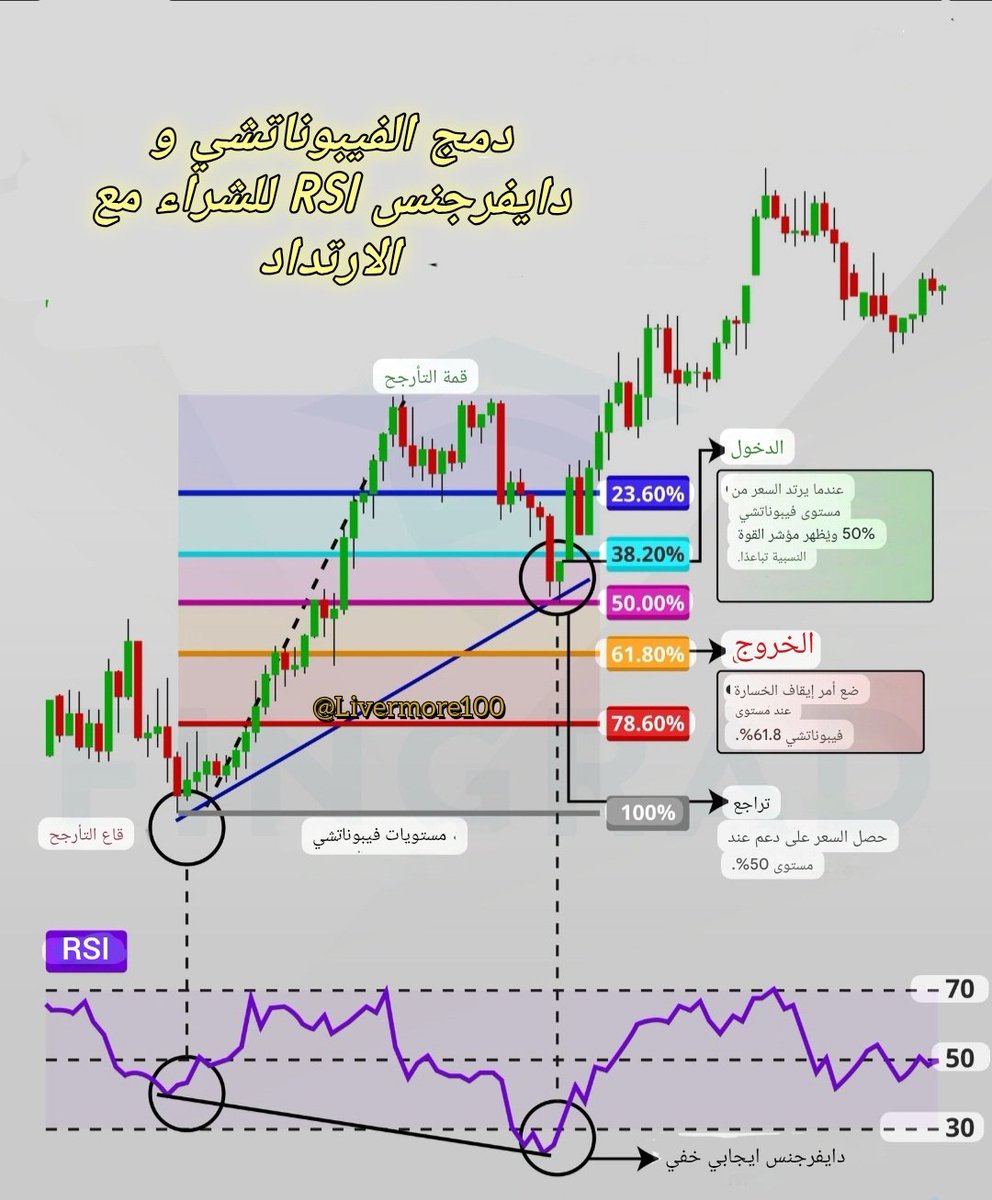
استراتيجية قوية لاقتناص الارتدادات : دمج الفيبوناتشي + دايفرجنس RSI
من أقوى طرق الدخول بعد موجة هبوط قصيرة داخل ترند صاعد هو الجمع بين:
1️⃣ مستويات فيبوناتشي لمعرفة أين يمكن أن يتوقف التصحيح
2️⃣ دايفرجنس إيجابي خفي على RSI لتأكيد استمرار الاتجاه الصاعد
طريقة العمل:
• حدّد قاع الترند ثم قمته.
• اسحب الفيبوناتشي من القاع للقمة.
• راقب مستويات 38.2% – 50% – 61.8% لأنها أقوى مناطق الارتداد.
• إذا ارتد السعر من منطقة 50% أو قريب منها، فهذه إشارة أولية.
إشارة الدخول الأساسية:
عندما يهبط السعر لمستوى فيبو قوي (مثل 50%)
ويتشكل على RSI دايفرجنس إيجابي خفي
(السعر يصنع قاعًا أدنى بينما RSI يصنع قاعًا أعلى)
➡️ هنا نعتبر أن التصحيح انتهى، والمتوقع استكمال الصعود.
📈 الدخول:
بعد ظهور شمعة انعكاسية عند مستوى فيبو والأفضل فوق 38.2%.
📉 إيقاف الخسارة:
أسفل مستوى 61.8% فيبوناتشي.
🎯 أهداف الخروج:
• الهدف الأول عند مستوى 38.2%
• الهدف الثاني عند م��توى القمة السابقة
• ويمكن الاستمرار إذا ظهرت قوة شرائية
لماذا تعمل هذه الطريقة؟
لأن الدايفرجنس يخبرك أن الزخم الحقيقي للصعود لم ينتهِ، والفيبوناتشي يحدد لك أين ينتهي التصحيح بال��بط.
الدمج بين المؤشرين يعطيك دخولًا مبكرًا ودقيقًا مع مخاطرة منخفضة جدًا.
#السعوديه_عمان
ماتعرف تحلل ايليوت وترقيم الموجات ..🗯️
انسخ Prompt الي تحت وارسله الى : ChatGPT
وبعدها ارسله صوره لشارت العمله الي تبيه يحللها لك
وراح يحللها لك بالتفصيل بناء على مدرسه Elliott 🌟
———
أنت خبير تحليل فني مخضرم في مدرسة إليوت (Elliott Wave Theory).
سأرسل لك شارت عملة أو أصل مالي.
دورك هو تحديد البنية الموجية الحالية بالتفصيل (Impulse أو Corrective)،
مع ترقيم الموجات (1-2-3-4-5 أو A-B-C أو W-X-Y-Z) وتوضيح موقع السعر داخل الدورة الكبرى.
أجب بالصيغة التالية:
1.الموجة الحالية: أي موجة نتحرك فيها الآن (مثلاً: داخل الموجة 3 من C).
2.نوع الهيكل: اندفاعي / تصحيحي / مثلث / فلات / زجزاج مزدوج.
3.مستويات رئيسية: مناطق بداية ونهاية الموجات مع الأهداف المحتملة (فيبوناتشي + امتدادات).
4.السيناريوهات:
•سيناريو أساسي (الاحتمال الأعلى).
•سيناريو بديل في حال كسر مستوى رئيسي.
5.الترابط الزمني: كيف يتوافق هذا النمط مع البنية الأعلى (مثلاً من Daily إلى 4H).
6.ملاحظات الموجي: وجود تداخل، انحراف، أو اختصار موجة خامسة.
استخدم لغة موجية دقيقة، مع ترقيم واضح، وتبرير منطقي لترتيب الموجات.
لا تصف الحالة العامة للسوق، فقط التركيب الموجي كما يراه محلل إليوت محترف
———
#Bitcoin #BTC #BTCUSDT #ElliottWave #Crypto #تحليل_فني #تحليل_موجي #بيتكوين #تداول
⁉️هل تحلم بتحويل 1000 دولار إلى مليون؟ هل تؤيد اقامة ورشة عمل أو دورة لأقوى أسرار تداول الأوبشن وتكتشف الاستراتيجية التي ستأخذك إلى القمة.
‼️استراتيجية مبتكرة لتداول الخيارات SPX وSPY، مصممة لتحقيق أرباح تراكمية تصل إلى 500-600 دولار لكل صفقة، مما يمهد الطريق للوصول إلى مليون دولار من خلال إعادة استثمار الأرباح.
Hero or Zero: استراتيجية جريئة في النصف ساعة الأخيرة 😯لتحقيق مكاسب استثنائية!
💯مع ضمان استرداد 100% من قيمة الدورة
إذا التزمت بالاستراتيجية بدقة ولم تحقق أرباحًا تراكمية، تسترجع قيمة الدورة
#spx #spx500 $spy #optiontrading #سوق_الاسهم_السعودي #سوق_الاسهم #تاسي