Independent Reanalysis of Hurricane Camille’s Landfall Intensity
This continues the series re-evaluating peak and landfall intensities of historic Atlantic Category 5 hurricanes, with emphasis on structure — especially radius of maximum winds — and modern pressure–wind relationships. Before examining the data, here are the official values as they currently stand:
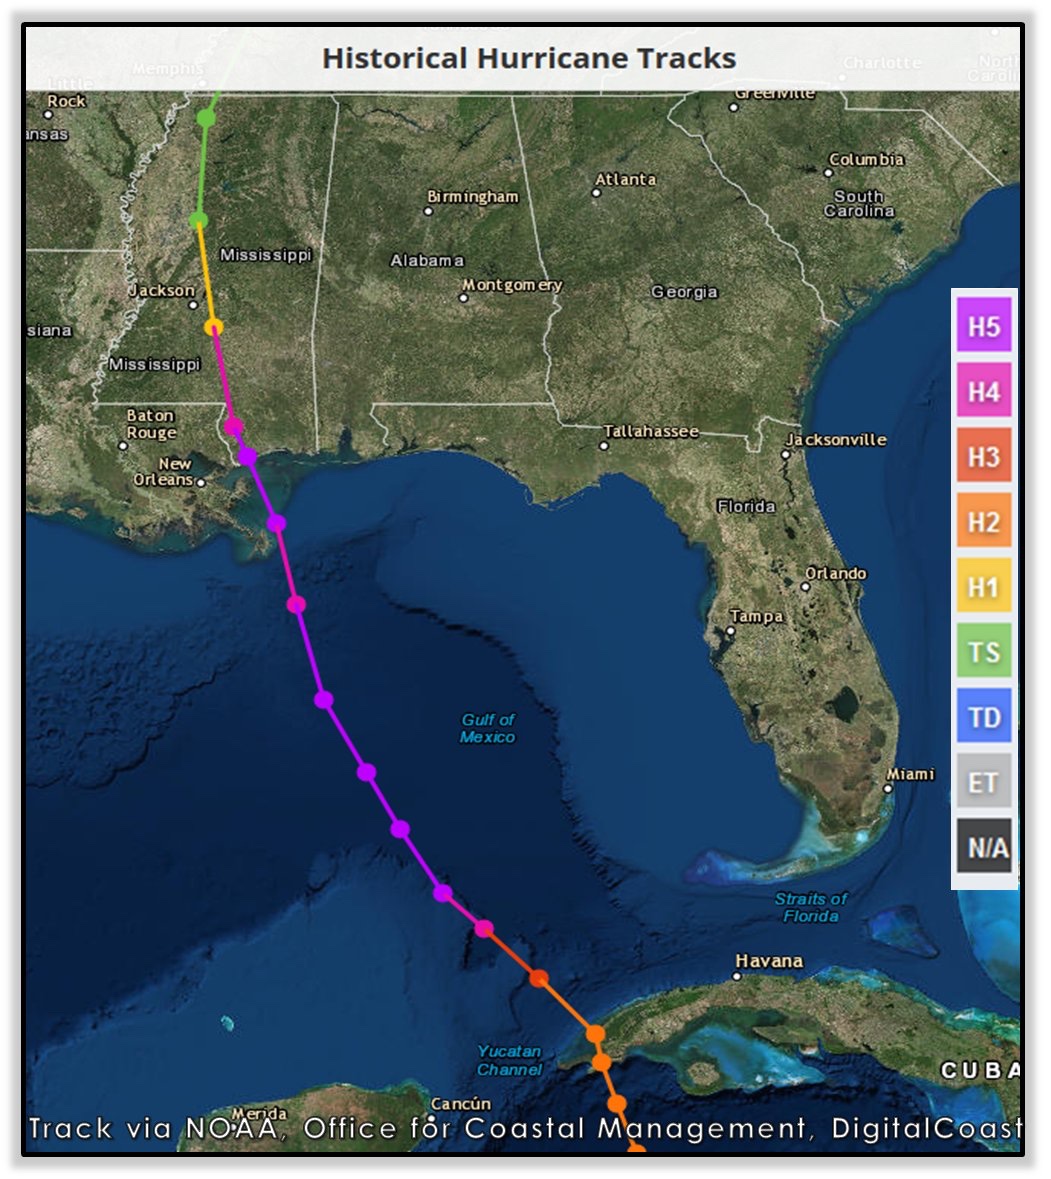
Official NHC (2016 reanalysis) at Mississippi landfall (0400 UTC 18 August 1969, near Waveland):
* MSW: 150 kt (175 mph)
* MSLP: 900 mb
The Data Review
1. Surface Barometer Readings:
The best quantitative data are Charles Breath’s calibrated marine aneroid observations from Bay St. Louis:
* 909 mb at the onset of the eye
* 904 mb a short distance farther west into the eye
The eye was about 8–12 n mi in diameter. The calm period at Bay St. Louis lasted only 10 minutes, which is consistent with the observations being taken on the eastern periphery of the eye (roughly 3–4 n mi from the geometric center), not at the exact center. A modest additional drop from the edge of the eye to the true center is expected. Central pressure at landfall is therefore assessed at 900 mb, which matches the official reanalysis. That said, a slightly lower value in the 898–900 mb range remains possible.
2. Structure:
* RMW: 6–8 n mi (very compact)
* Forward speed: 15 kt
* Latitude: 30.3°N
* Evidence of an earlier eyewall replacement cycle, with recovery in the final hours before landfall under warm water and relatively low wind shear
Of these, the tiny core is the key structural factor. It supports a more peaked wind profile and higher winds for a given central pressure.
3. Pressure–Wind Relationships:
The following pressure–wind relationships were applied to 900 mb (and the possible 898–900 mb range), accounting for Camille’s small RMW, latitude, and forward speed:
* Revised Holland (2008), with elevated b_s appropriate for a compact core: midpoint near 155 kt
* Brown et al. (2006) and KZC/Courtney–Knaff (2009): 150–155 kt, with the small-size adjustment favoring the higher end
4. Columbia, Mississippi Inland Wind Observation:
About 4 hours after landfall, Columbia reported a 104 kt fastest-mile wind in or near the remnant RMW. That figure converts to approximately
99 kt as a peak 1-minute wind.
The Kaplan–DeMaria inland decay model, using a 150 kt landfall intensity, predicts about 101 kt at that time/location — almost an identical match.
Even so, two additional points suggest a slightly higher landfall value is appropriate:
* A single anemometer is unlikely to have sampled the absolute peak.
* Compact, high-intensity storms often weaken more rapidly after landfall. Retaining nearly 100 kt that far inland is therefore more consistent with a landfall intensity toward the high end of the 150–155 kt range.
Final Independent Estimate
* Maximum sustained winds: 155 kt (180 mph)
* Central pressure: 900 mb (possible range 898–900 mb)
This reanalysis constitutes a modest upward revision from the official 150 kt. It is driven by the tiny RMW, modern pressure–wind relationships that credit compact structure, and the inland observation once under-sampling and faster compact-core decay are considered. The result is consistent with the structural framework used across the rest of the high-end Atlantic Category 5 reanalysis series and with the current state of the science.
#Hurricane
How Strong was Tropical Storm Edouard at Landfall?
The purpose of this reanalysis is simply to determine the single best landfall intensity estimate from the respective in-situ observations. It is not a forecast verification or a defense of any pre-landfall intensity forecast.
The NHC set the official landfall intensity to the Texas Point NOS measurement: 50 kt. As this reanalysis will show, that one observation was not representative of the storm-scale maximum sustained winds (Vmax). Before reviewing the pertinent data, here are the official operational landfall stats as they currently stand.
Landfall: 2:20 PM CDT/1920 UTC Tuesday, 1 September 2026
Location: Johnson Bayou, Louisiana (29.7°N, 93.8°W)
Official intensity: 50 kt (60 mph)
Official pressure: 996 mb
The in-situ observations from the same afternoon are below, beginning with Texas Point — the measurement the official intensity was set to.
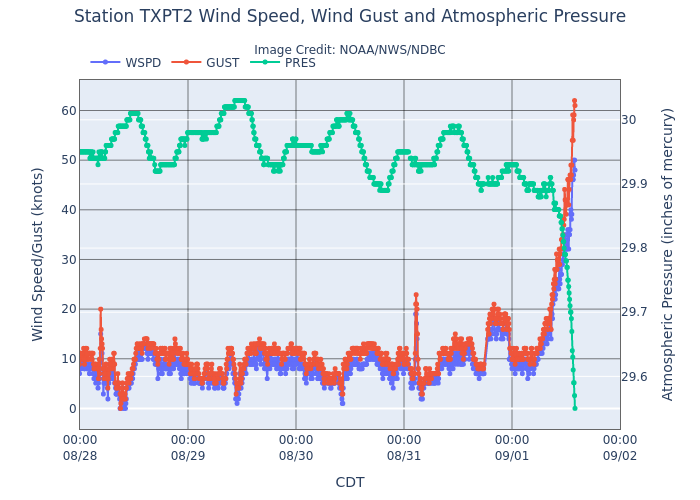
Texas Point (NOS 8770822/TXPT2) 29.689°N, 93.842°W. Anemometer 12.5 m.
1854 UTC/1:54 PM CDT — 26 minutes before landfall:
* 25.7 m/s sustained/31.9 m/s gust
* 50 kt/62 kt
* Published as 57 mph/71 mph
* NWS LCH LSR: M71 at 1:54 PM (5 SE Sabine Pass); M68 at 1:30 PM at the same site
* 2.3 n mi WSW of the 1920Z center (bearing 253°), wind 340°
* Western eyewall, left of track
To accept any measured observation as Vmax, one has to believe that a single anemometer was so perfectly placed that it recorded the absolute highest sustained wind contained anywhere in the storm. To say it is highly unlikely is a major understatement. That alone merits an additional 5 kt if the anemometer was located within the radius of maximum wind (RMW) in the right-side quadrant. In this case, the observation was made 2.3 n mi west-southwest of the center, in the western eyewall, left of track. That is *not* where the peak winds were located. The western-eyewall sample was weaker on its own for a second, physical reason: the wind at Texas Point was offshore. Flow off the land lowers the 10-m wind relative to the same radius on the onshore right side. That frictional difference, plus the fact the mast was not in the right-side RMW, is why the second 5 kt is conservative.
Given those two very important factors, a reasonable, conservative estimate derived from Texas Point is 60 kt.
Pleasure Island
The Lake Charles NWS local storm report (LSR) lists a measured (M) wind gust of 90 mph at Pleasure Island (2 S Port Arthur) at 4:51 PM CDT. This same site also had M77 mph at 4:48 PM. No call sign provided in the LSR. NWS accepted both as measured.
Unfortunately, there was not an accompanying one-minute wind value. Consequently, we have to determine the appropriate gust factor (GF) in order to recover the 1-minute wind speed at that site.
Exact same-minute pairs used for gust factor:
* TXPT2: 57/71 mph (1.25) — eyewall marine
* KBPT: 37/55 mph (1.49) — inland core/ASOS
* Port Arthur station: 38/59 mph (1.55) — inland core/city
Although KBPT had M69 at 4:18 PM, there is no same-minute 2-minute with that 69. As a result, it can’t be used as a GF pair.
The exact pairs fall into two distinct classes:
* Open-Gulf/NOS eyewall: Texas Point 1.25.
* Inland airport/city: KBPT 1.49, Port Arthur 1.55.
Neither class fits Pleasure Island (PI). The actual site is a channel/lake shore — more roughness than Texas Point and far less than KBPT. A GF of 1.25 gives the 90 too much marine credit, while 1.49–1.55 treats it like a city/airport fetch. Both are inapplicable.
The most realistic gust factor range for PI is 1.35-1.40. That converts the NWS-verified 90 mph gust to a 56–58 kt implied 1-minute at 4:51. To be most conservative, 1.40 is chosen for this reanalysis. A 56 kt implied inland sample 2.5 hours after landfall means landfall had to be inherently higher.
An ordinary/small filling rate over that period easily gets to 60 kt. Furthermore, it would only require an 8 kt fill over 2.5 hours (~3.2 kt/hr) to be hurricane force. That fill rate is physically possible, but there’s no conclusive evidence to prove it occurred in this case.
As with the Texas Point observation, the same undersampling principle applies to the 56 kt value. One inland anemometer at 4:51 was certainly not Vmax. That adds 5 kt on its own (61 kt). Combined with the fact the gust was 2.5 hours after landfall, another 5 kt is ordinary. Those two 5 kt additions reach 66 kt. For this reason, 60 kt is as low as a conservative landfall estimate can possibly be, and a reasonable argument can be made for 65 kt.
Those are not the only inland measured gusts after landfall. The same LSR product lists additional high-60s and low-70s gusts well inland and many hours later. They are gust-only and are not used for a GF. They matter because they show the Pleasure Island 90 mph was not simply a one-station spike.
Later inland gusts:
* M68 at 5:09 PM, 2 NNW Port Arthur
* M70 at 5:27 PM, Central Gardens
* M73 at 6:38 PM, 1 SW Lumberton — 4 hours 18 minutes after landfall
Conclusion
As we’ve systematically proven through a thorough analysis of the objective in-situ data, it’s physically impossible for 50 kt to have been the legitimate landfall intensity of #Edouard.
Even without the Pleasure Island observation, a single anemometer recording winds from an offshore direction is not going to capture Vmax. Texas Point alone does not support 50 kt as the landfall intensity. The absolute floor from Texas Point is 55 kt if only the first undersampling increment is applied. A conservative estimate from that mast is 60 kt.
The Pleasure Island observation does exist. A conservative 1.40 conversion of the NWS-verified 90 mph gust implies 56 kt at 2.5 hours inland. Obviously, that was not landfall and certainly not Vmax. With that observation in the record, 60 kt is as low as a conservative landfall estimate can be, and opens the door for 65 kt.
The same LSR product still had near-hurricane-force measured gusts hours later, including M73 mph at Lumberton more than 4 hours after landfall. It further substantiates that a conservative landfall estimate is no less than 60 kt.
Although these data provide a reasonable argument that Edouard might’ve been a 65 kt #hurricane when it crossed the shoreline near Johnson Bayou, the single best estimate is set at 60 kt.
@cary_mock Try less than 50% probability, as in it is *less* likely 1914 produced zero hurricanes in the NATL basin that year.
I’m not even going to respond to your definitive assertion that I’m “not knowledgeable on earlier data.” 🙄
Yes, but it’s highly unlikely they’ll go above 60 kt as they’re more conservative on these estimates than I am.
Even though it’s possible Edouard was 65 kt at landfall, the supporting evidence is just a little too inconclusive to make that jump. That’s why I settled on 60 kt.
That said, it was about as strong as a 60 kt (70 mph) tropical storm can possibly be.
To put it into proper perspective: Think about how many 65 kt hurricanes there are in the historical record that didn’t even come close to producing a recorded 90 mph gust — much less one 2.5 after landfall.
How Strong was Tropical Storm Edouard at Landfall?
The purpose of this reanalysis is simply to determine the single best landfall intensity estimate from the respective in-situ observations. It is not a forecast verification or a defense of any pre-landfall intensity forecast.
The NHC set the official landfall intensity to the Texas Point NOS measurement: 50 kt. As this reanalysis will show, that one observation was not representative of the storm-scale maximum sustained winds (Vmax). Before reviewing the pertinent data, here are the official operational landfall stats as they currently stand.
Landfall: 2:20 PM CDT/1920 UTC Tuesday, 1 September 2026
Location: Johnson Bayou, Louisiana (29.7°N, 93.8°W)
Official intensity: 50 kt (60 mph)
Official pressure: 996 mb
The in-situ observations from the same afternoon are below, beginning with Texas Point — the measurement the official intensity was set to.
Texas Point (NOS 8770822/TXPT2) 29.689°N, 93.842°W. Anemometer 12.5 m.
1854 UTC/1:54 PM CDT — 26 minutes before landfall:
* 25.7 m/s sustained/31.9 m/s gust
* 50 kt/62 kt
* Published as 57 mph/71 mph
* NWS LCH LSR: M71 at 1:54 PM (5 SE Sabine Pass); M68 at 1:30 PM at the same site
* 2.3 n mi WSW of the 1920Z center (bearing 253°), wind 340°
* Western eyewall, left of track
To accept any measured observation as Vmax, one has to believe that a single anemometer was so perfectly placed that it recorded the absolute highest sustained wind contained anywhere in the storm. To say it is highly unlikely is a major understatement. That alone merits an additional 5 kt if the anemometer was located within the radius of maximum wind (RMW) in the right-side quadrant. In this case, the observation was made 2.3 n mi west-southwest of the center, in the western eyewall, left of track. That is *not* where the peak winds were located. The western-eyewall sample was weaker on its own for a second, physical reason: the wind at Texas Point was offshore. Flow off the land lowers the 10-m wind relative to the same radius on the onshore right side. That frictional difference, plus the fact the mast was not in the right-side RMW, is why the second 5 kt is conservative.
Given those two very important factors, a reasonable, conservative estimate derived from Texas Point is 60 kt.
Pleasure Island
The Lake Charles NWS local storm report (LSR) lists a measured (M) wind gust of 90 mph at Pleasure Island (2 S Port Arthur) at 4:51 PM CDT. This same site also had M77 mph at 4:48 PM. No call sign provided in the LSR. NWS accepted both as measured.
Unfortunately, there was not an accompanying one-minute wind value. Consequently, we have to determine the appropriate gust factor (GF) in order to recover the 1-minute wind speed at that site.
Exact same-minute pairs used for gust factor:
* TXPT2: 57/71 mph (1.25) — eyewall marine
* KBPT: 37/55 mph (1.49) — inland core/ASOS
* Port Arthur station: 38/59 mph (1.55) — inland core/city
Although KBPT had M69 at 4:18 PM, there is no same-minute 2-minute with that 69. As a result, it can’t be used as a GF pair.
The exact pairs fall into two distinct classes:
* Open-Gulf/NOS eyewall: Texas Point 1.25.
* Inland airport/city: KBPT 1.49, Port Arthur 1.55.
Neither class fits Pleasure Island (PI). The actual site is a channel/lake shore — more roughness than Texas Point and far less than KBPT. A GF of 1.25 gives the 90 too much marine credit, while 1.49–1.55 treats it like a city/airport fetch. Both are inapplicable.
The most realistic gust factor range for PI is 1.35-1.40. That converts the NWS-verified 90 mph gust to a 56–58 kt implied 1-minute at 4:51. To be most conservative, 1.40 is chosen for this reanalysis. A 56 kt implied inland sample 2.5 hours after landfall means landfall had to be inherently higher.
An ordinary/small filling rate over that period easily gets to 60 kt. Furthermore, it would only require an 8 kt fill over 2.5 hours (~3.2 kt/hr) to be hurricane force. That fill rate is physically possible, but there’s no conclusive evidence to prove it occurred in this case.
As with the Texas Point observation, the same undersampling principle applies to the 56 kt value. One inland anemometer at 4:51 was certainly not Vmax. That adds 5 kt on its own (61 kt). Combined with the fact the gust was 2.5 hours after landfall, another 5 kt is ordinary. Those two 5 kt additions reach 66 kt. For this reason, 60 kt is as low as a conservative landfall estimate can possibly be, and a reasonable argument can be made for 65 kt.
Those are not the only inland measured gusts after landfall. The same LSR product lists additional high-60s and low-70s gusts well inland and many hours later. They are gust-only and are not used for a GF. They matter because they show the Pleasure Island 90 mph was not simply a one-station spike.
Later inland gusts:
* M68 at 5:09 PM, 2 NNW Port Arthur
* M70 at 5:27 PM, Central Gardens
* M73 at 6:38 PM, 1 SW Lumberton — 4 hours 18 minutes after landfall
Conclusion
As we’ve systematically proven through a thorough analysis of the objective in-situ data, it’s physically impossible for 50 kt to have been the legitimate landfall intensity of #Edouard.
Even without the Pleasure Island observation, a single anemometer recording winds from an offshore direction is not going to capture Vmax. Texas Point alone does not support 50 kt as the landfall intensity. The absolute floor from Texas Point is 55 kt if only the first undersampling increment is applied. A conservative estimate from that mast is 60 kt.
The Pleasure Island observation does exist. A conservative 1.40 conversion of the NWS-verified 90 mph gust implies 56 kt at 2.5 hours inland. Obviously, that was not landfall and certainly not Vmax. With that observation in the record, 60 kt is as low as a conservative landfall estimate can be, and opens the door for 65 kt.
The same LSR product still had near-hurricane-force measured gusts hours later, including M73 mph at Lumberton more than 4 hours after landfall. It further substantiates that a conservative landfall estimate is no less than 60 kt.
Although these data provide a reasonable argument that Edouard might’ve been a 65 kt #hurricane when it crossed the shoreline near Johnson Bayou, the single best estimate is set at 60 kt.
As explained in the analysis, the observation at Pleasure Island firmly establishes the floor. A conservative implied 1-minute wind of 56 kt (taken from the 90 mph gust) makes it impossible for Vmax to be any lower than that value.
Of course, that observation was recorded 2.5 hours after landfall, so Vmax was most certainly higher at the coast (no less than 60 kt). Taking into consideration the likelihood that the single mast didn’t actually measure the peak winds at that time, it’s fairly easy to arrive at 65 kt.
I settled on 60 kt simply because there’s no known accompanying 1-minute wind value for the 90 mph gust. Without that, I believe a more conservative estimate is appropriate.
@mrmojobones I’m confused where some are getting that I’m suggesting 65 kt is the best single estimate? I clearly stated it to be 60 kt.
That said, 65 kt is more likely than 55 kt based on an objective analysis of the in-situ data.
A borderline 60 kt strong tropical storm/hurricane was the most likely intensity of #Edouard at landfall.
From a probability perspective, I’d list them as the following:
50 kt: 3%
55 kt: 10%
60 kt: 52%
65 kt: 30%
70 kt: 5%
65 kt constitutes #hurricane strength. I calculate an 82% chance that it was 60-65 kt.
The only possible way 50-55 survives is to throw out the 90 mph gust observation 2.5 hours after landfall, Texas Point is treated as perfectly sited Vmax, the peak is assumed to have been in the western quadrant, and offshore flow is assumed not to have lowered that measurement.
The hurricane prospects are much higher because a conservative implied 1-minute wind at Pleasure Island (56 kt) only requires a small 4 kt fill-rate and the high likelihood that the single mast didn’t record the absolute peak wind at that time.
Given those factors, 60 kt is the single best estimate to settle upon, while 65 kt remains a realistic possibility.
@Louisianafotos It’s possible that a storm can gain a *little* additional strength by moving over very warm, marshy terrain near the coast — such as was the case with Fay 2008 in Fl.
That wasn’t the situation with Edouard, however.
@Louisianafotos Camille was already intensifying as its eye barely crossed over extreme SE Louisiana on its way to devastating the Mississippi coastal areas.
Consequently, there’s no evidence that it gained any strength from its eye brushing by the marshes of Louisiana.
That’s not accurate. The strongest winds were in the SSE portion of the eyewall based on the aforementioned inland observations (such as Pleasure Island). Moreover, the highest WSR-88 Doppler radial velocities were also on the right side of the circulation.
Too many assume that the strongest winds are always located within the deepest convection, but that’s not the reality. Most often, the highest reflexivity’s are in the western quadrant, while the strongest winds remain in the eastern quadrant.
Charley 2004, Michael 2018, and Milton 2024, are just a few quick examples of countless others.
It didn’t get stronger inland. The pressure was consistently rising as it pushed inland from the coast, as is expected.
Not to mention, friction naturally causes a significant reduction in the sustained winds.
It seemed much stronger to so many because the official landfall intensity was so low. There’s about a 30% chance it was actually a hurricane.
Then again, there’s very little practical difference between a 60 kt high-end TS and a 65 kt hurricane.
@primitivojc47@capitanclima24 Actually, it was rapidly intensifying as it crossed the shoreline, so it likely only needed another couple of hours to achieve hurricane strength.
The strongest winds at Pleasure Island were on the eastern side. The other highest-wind observations were also recorded in the SSE portion of the eyewall.
Consequently, it’s difficult to subscribe to the notion that the strongest winds would’ve been located in the western eyewall and from an overland (offshore direction).
@BobbiStorm Thank you, Bobbi! It’s a classic IR satellite image at landfall. Last major #hurricane landfall on the U.S. east coast north of Hutchinson Island, FL.