How to combine LLMs with graph visualization? 🤔 From raw AI output to interactive, production-ready diagrams—at scale.
Webinar coming soon! Stay tuned. 🚀
Insights:
👉 https://t.co/kC1VMJVlFp
👉 https://t.co/Nk1dr25PNr
Understand exactly how your network changes over time. ⏱️ Our Event Timeline demo turns chaotic time-series data into a clear story with smart edge aggregation and interactive zooming. Perfect for IT incident response, supply chain tracking, and more!
👉 https://t.co/cPHjOrsLjz
Keep your graphs perfectly predictable and structured, even when adding new elements.
yFiles v3.1 introduces precise, per-item control over incremental hierarchical layouts! 📐✨
👉 Try the live demo at https://t.co/jO0Q29Jx67
🔥 Our new Heat Map demo for yFiles for HTML 3.1 turns complex metrics (CPU load, latency, risk scores) into intuitive color gradients. Easily identify bottlenecks & performance spikes across nodes/edges with customizable color schemes & backgrounds!
Demo: https://t.co/dfp33829Ow
Our VSDX export is now compatible with yFiles for HTML 3.1! 🚀
Check out the new squircle shape—the perfect blend of square and circle for a modern look.
📝 Release notes: https://t.co/q2YogKRnD1
💡 Overview: https://t.co/a3Lh5p6heG
Data quality is key for reliable knowledge graphs. How do you handle duplicates & isolated entities at scale?
Watch our #KGC 2026 Tools Track demo to see how yFiles enables real-time exploration & seamless data maintenance.
https://t.co/UTNAejJyJd https://t.co/QuqdJrLebP
yFiles for HTML 3.1 is out. Our CTO walks through highlights like smart WebGL scaling, integrated heatmaps, and seamless edge bundling. The session also covers enhanced interactivity for tooltips, popovers, and toolbars.
Webinar: https://t.co/6zKuJCcwUt
yFiles for HTML 3.1 has arrived! 🚀 Featuring new edge bundling, heatmaps, and WebGL scaling for ultimate performance. Clearer diagrams, smarter scaling, better results.
Explore the update: https://t.co/0GMvrFW1ge
It’s webinar day! Join us today at 5:00 PM CEST to see how yFiles and @AvaloniaUI work together for high-performance cross-platform network visualizations.
You can still register
LinkedIn: https://t.co/eM5WON9WvQ
Zoom: https://t.co/45ujR0nNf1
If you're tackling #NetworkVisualization within @AvaloniaUI, you won't want to miss this. We’re exploring how you can handle even the most complex data structures across every platform using yFiles. 🚀
Secure your spot: https://t.co/45ujR0nNf1
One day to go! ⏳
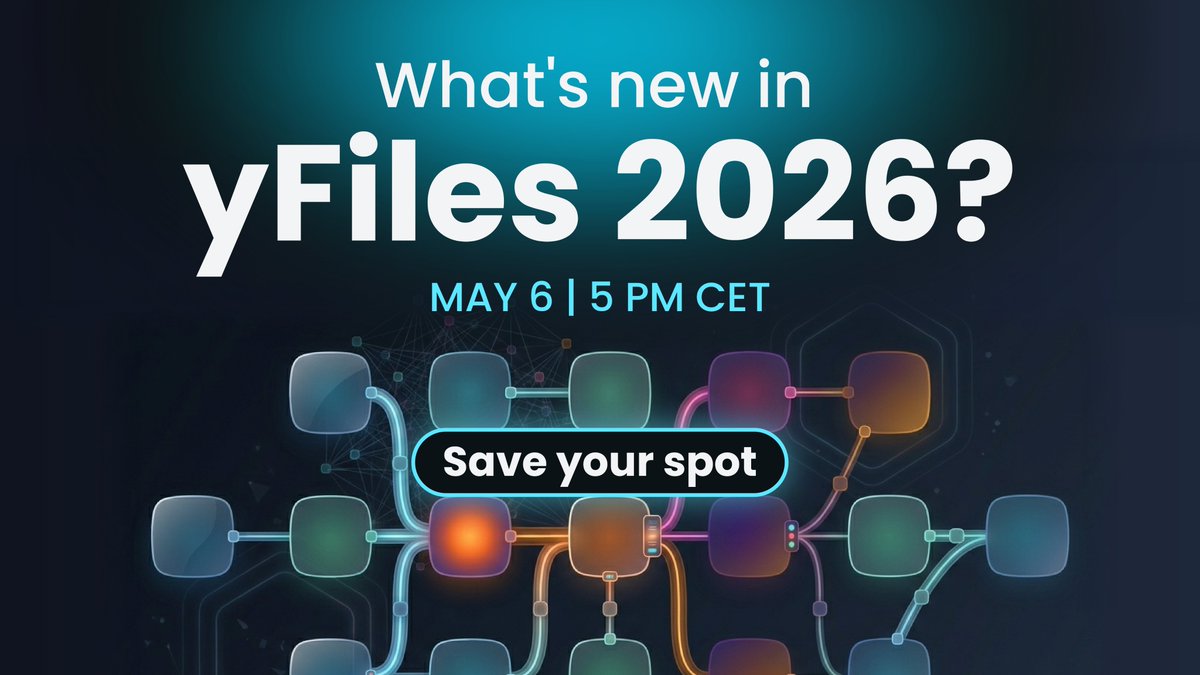
If you haven't registered yet, now is the time. The next major yFiles for HTML release is almost here.
Join us tomorrow, May 6, at 5 PM CET, for a first look at the new features and live API demos.
Save your seat! https://t.co/g8AtWjmeCr
Wishing everyone an amazing #KGC2026! 🎓✨
Counting down to Friday, May 8, where yWorks joins the Tools & Demo Track. Join to see the latest in #GraphVisualization and how to optimize your stack.
Explore our Knowledge Graph Demo: 👉 https://t.co/iNeumUDR8v
#KnowledgeGraph
May the Force(-Directed Layout) be with you! 🌌
With yFiles, skip the Jedi mind tricks. Our algorithms bring nodes into perfect equilibrium automatically—because no one should have to debug a manual diagram.
"Visualize, or do not. There is no 'try'." 🧘♂️
https://t.co/DyHv9nXTfD
What are we cooking up in the Graph Visualization Kitchen? 🍳 On May 6, we'll be serving up an exclusive first look at the next major release of yFiles for HTML.
Real demos. Real code. Real depth in the Q&A.
📅 May 6 | 5 PM CET
🔗 Register directly here: https://t.co/g8AtWjmeCr
New look, same power. ⚡️
Our network visualization demos just got a major redesign—the first glimpse into the upcoming release of yFiles for HTML! 🚀
Try it out: https://t.co/bVdl6AdWsn
#SDK#GraphViz#JavaScript#WebDev
yFiles for @Avalonia EAP 3 is here! ✨
Now with full support for Avalonia 12. Note: We’ve shifted focus from Avalonia 11—let us know if you still need it!
Together, we’re building something better. 🚀
Try the EAP: https://t.co/ce7xNPKdrS
#AvaloniaUI#DotNet#CSharp
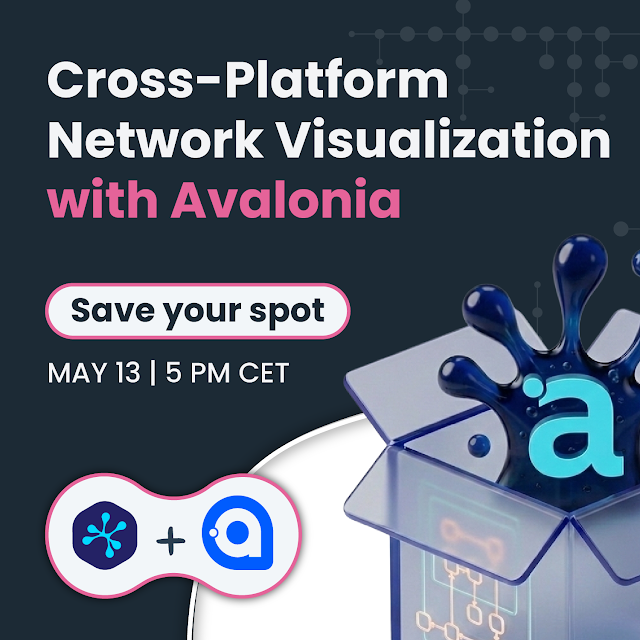
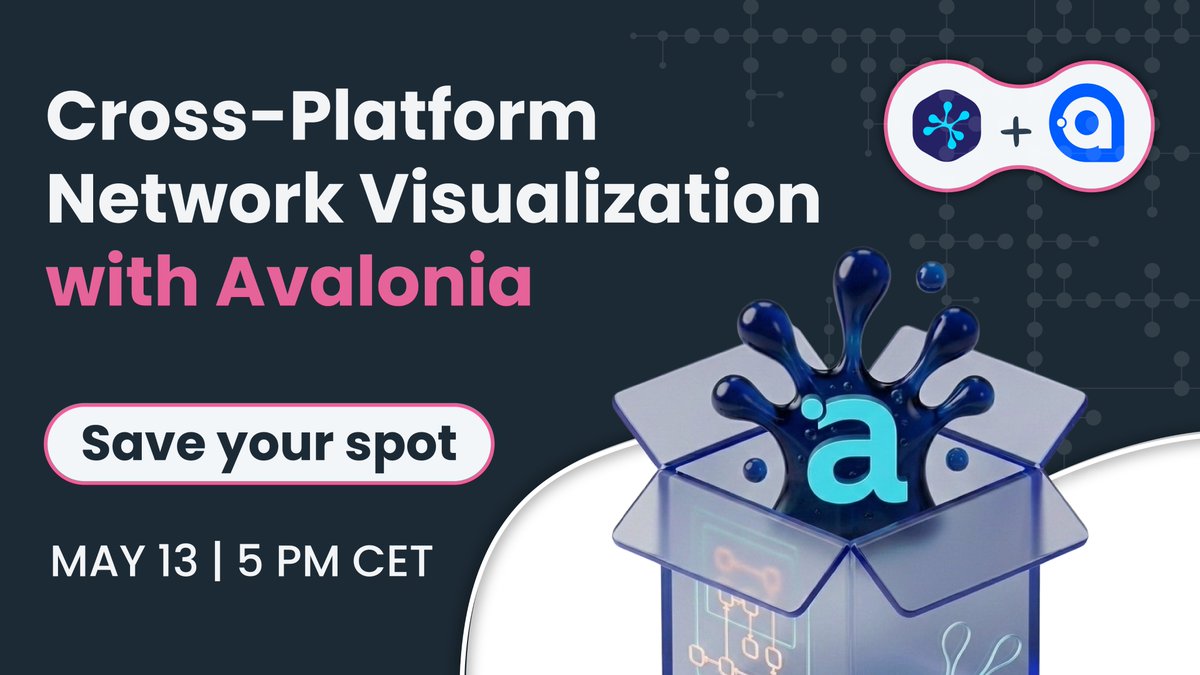
Unlock the power of yFiles for @AvaloniaUI! 🚀
Build high-performance, cross-platform apps for Windows, macOS, Linux, Web & Mobile. Join our webinar on May 13, 5 PM CET to transform complex data into clear stories.
Register: https://t.co/jOHaMEWlH3
#AvaloniaUI#DotNet#yFiles
yFiles for @Avalonia EAP 2 is here! 🚀
New in this release:
💡 Expanded Demo Suite + redesigned overview
📤 High-quality Image Export
✨ Refined rendering & bug fixes
Build the future of cross-platform network visualization:
https://t.co/ce7xNPKdrS
#DotNet#DataViz#CSharp
Spring cleaning isn't just for closets—tidy up your diagrams, too! 🌼
One click transforms chaotic data into clear visualizations. Whether you prefer Organic or Orthogonal layouts, we’ve got you covered. 🐣
Hunt for clarity: https://t.co/6jWR8uZcWn