Will the Fed raise rates by 25 bps at the September meeting?
🏦 Market: 34.5% VS Yarrow: 24% ☘️
Here's the arithmetic behind our number.
Start with the vote. July was 9-3 to hold. Only three members dissented toward a hike. For a 25bp increase to pass in September, you need four of the nine hold-voters to flip — in 27 days.
Now check whether the conditions for flipping exist:
The hawks' trigger was explicit in the minutes: tighten "if inflation did not decline." But it did decline. July CPI fell on both headline and core. That conditional mandate hasn't activated.
Payrolls fell in July with large downward revisions, taking pressure off the employment side. Oil has dropped on the Iran-Oman corridor talks. And critically — not a single Board governor has publicly shifted position since the July meeting. Zero.
A hike needs a 7-vote threshold to pass a 9-3 hold bloc. Seven governors are currently aligned on hold. The July dissenters asked for 25 — none asked for 50. The current target range is 3.50-3.75%; a hike would push the upper bound to 4.00%, increasing bank funding costs and tightening financial conditions at a moment when the labor market is already softening.
☘️ Our engine ran this through six independent analysts across four models: The median landed at 16.5%, with dispersion of 0.066. After a second review incorporating Jackson Hole positioning and the latest data, the reviewed number came up to 24% — still well below the market's 34.5%.
Three data points will settle this before the meeting:
📅 August 28 — Jackson Hole. If the Chair signals tightening, the hold bloc cracks.
📅 September 4 — Payrolls. A hot jobs print revives the hike case.
📅 September 11 — CPI. Core PCE at 0.3%+ would be the single strongest trigger.
None of these has happened yet. The market is pricing the possibility. We're pricing the evidence so far.
September 16 ☘️
The September Fed decision.
☘️ Yarrow: 83% chance they hold. 15% chance of a 25bp hike.
🏦 The market: 71% hold, 28% hike.
The split is on the hike side: markets think a rate increase is twice as likely as we do.
🤔 Why we lean hold: inflation has cooled for two straight months, giving the Fed room to wait. Yes, PCE is still above target and a few members lean hawkish, but the data doesn't scream "hike."
We ran this question through two completely separate processes: one with hand-picked evidence, one fully automated. They landed on nearly the same number: 83% vs 82.5%. That kind of convergence is hard to ignore.
* What could shift our view: a hot August CPI print on September 10. That's the one data point that could change the math before the meeting.
September 16. We'll see. 🫣
Update on the Strait of Hormuz — same question, longer window, bigger disagreement.
8/20 we posted this with a September deadline.
🏦 Market: 7% VS Yarrow: 15% ☘️
Today, with a December deadline.
🏦 Market: 37.5% VS Yarrow: still 15% ☘️
The market moved. We didn't. Here's why:
On August 25, Iran and Oman announced a phased corridor framework with joint mine-clearing. The market read that as normalization beginning and repriced from 7% to 37.5%.
We read the same headline and checked the water. The PortWatch 7-day transit average is about 5 ships per day. A year ago it was 94. The resolution threshold is 60. We're at the third percentile of the series' own history.
We've seen this movie: after the June memorandum, transits climbed from 3 to 30 in twelve days — then attacks resumed and the number dropped right back. August 18, a missile killed a chief engineer. August 24, a tanker was disabled near Oman. The corridor framework has no start date, and the US is not a party.
Four more months on the calendar doesn't change what's happening on the water. Ships come back when insurance costs fall and attacks stop — not when a framework is announced.
The market is pricing the headline.
We're pricing the ships. 🚢
🤔 What would move us: a corridor with a start date, PortWatch above 20 for two straight weeks, and zero attacks in that window.
Will Strait of Hormuz traffic return to normal by September?
🏦 Market says 7% VS Yarrow say 15% ☘️
Both sides agree: unlikely. But we think it's twice as likely as the market does.
🤔 Here's why.
Daily ship transits have dropped from 19 to about 3. War-risk insurance is still sky-high. Current traffic is running 80% below what counts as "normal."
But "normal traffic" is a much higher bar than "ceasefire." The market might be pricing whether the fighting stops — we're pricing whether the ships actually come back. Those are different questions with different timelines.
The Aug 5 Iran-Oman corridor talks are the kind of development that could restart shipping faster than expected. That's where the gap between 7% and 15% lives.
▶️ What could move us: a fast diplomatic deal that reopens transit corridors. The closest precedent was the Islamabad Memorandum — the only time traffic recovered quickly after a similar crisis.
If you had to forecast the policy direction of a country you'd never studied before, how would you do it? 🤔
Ask ChatGPT or another AI tool? It might give you a confident analysis — but with no accuracy record and no way to verify it.
Commission a report from a consulting firm? It could take months to get, and no one will ever go back and check how accurate it was.
Yarrow took a methodology built on data from a country we're not revealing yet and applied it directly to Malaysia, without any country-specific tuning:
🇲🇾 Brier 0.071 · 14 out of 15 correct · z = +8.8
Five Malaysian reform episodes — fuel-price shocks, the introduction of GST, and diesel subsidy retargeting. Every CPI outcome was verified against the official index from Malaysia's Department of Statistics. ✅
☘️ This is what Yarrow is trying to build:
A methodology that works without tuning is a methodology you can trust when analyzing data at the national level in the next country too.
2028 Democratic presidential nomination
🏦 The market: AOC at 22.5%, ahead of Newsom at 15%.
☘️ Yarrow's answer is the opposite — Newsom's probability is roughly 4x AOC's.
Why: the DNC moved South Carolina to first on the primary calendar, a state where moderate and Black voters dominate, the same coalition that rescued Biden's campaign in 2020. That structure favors establishment candidates like Newsom, not progressives like AOC.
His polling and fundraising are both recovering. Meanwhile, AOC has taken no concrete steps toward running — no announcement, no exploratory committee, no early-state organizing. The dominant view inside the party is that she's more likely to go for a Senate seat first.
🤔 We checked how fragile this conclusion is: we took away each supporting fact one at a time and re-ran the system 28 times. Even in the worst case, AOC's number only rises to 13% — still well below her market price. This isn't a call that depends on one piece of news.
☘️ When we'd revise: if AOC formally announces a presidential run, or if Newsom signals he won't run. Either event invalidates this call and we'll update publicly.
2021. The Federal Reserve predicted core inflation at 1.8%, Actual CPI hit 7.0%.
Off by nearly 4x. 📊
Mohamed El-Erian called it "the worst inflation call in the history of the Federal Reserve."
The most powerful forecasting institution on earth — with more data, more PhDs, and more compute than anyone — got the biggest macro question of the decade wrong.
Not because they lacked intelligence.
Because no one had frozen a prediction, waited for the outcome, and asked: "how far off were we — and why?"
That's what Yarrow does. ☘️
Every forecast locked before the answer. Scored after. Published either way. The discipline isn't being right — it's building a system that gets better every time it's wrong.
Will the US and Iran sign a final nuclear deal by year-end?
🏦 Market reference: about 26%
☘️ Yarrow: 6.5%
We're four times lower.
In June, the two sides signed a framework (MOU) with a roughly 60-day negotiation window. That window has now expired. Iran's precondition — Israel withdrawing from Lebanon — hasn't been met. No new round of talks is on the calendar.
For context: the original JCPOA took four times longer to go from framework to final signature than the time remaining in 2026.
Our automated system, running independently, landed at 23.5% — between our number and the market's. The gap is documented. We're standing by the lower figure.
That said — both sides have proven they can move fast when the will is there. The June MOU came together in weeks. If a new round gets announced with sanctions-sequencing language attached, we'll be the first to revisit.
Will Strait of Hormuz traffic return to normal by September?
🏦 Market says 7% VS Yarrow say 15% ☘️
Both sides agree: unlikely. But we think it's twice as likely as the market does.
🤔 Here's why.
Daily ship transits have dropped from 19 to about 3. War-risk insurance is still sky-high. Current traffic is running 80% below what counts as "normal."
But "normal traffic" is a much higher bar than "ceasefire." The market might be pricing whether the fighting stops — we're pricing whether the ships actually come back. Those are different questions with different timelines.
The Aug 5 Iran-Oman corridor talks are the kind of development that could restart shipping faster than expected. That's where the gap between 7% and 15% lives.
▶️ What could move us: a fast diplomatic deal that reopens transit corridors. The closest precedent was the Islamabad Memorandum — the only time traffic recovered quickly after a similar crisis.
The September Fed decision.
☘️ Yarrow: 83% chance they hold. 15% chance of a 25bp hike.
🏦 The market: 71% hold, 28% hike.
The split is on the hike side: markets think a rate increase is twice as likely as we do.
🤔 Why we lean hold: inflation has cooled for two straight months, giving the Fed room to wait. Yes, PCE is still above target and a few members lean hawkish, but the data doesn't scream "hike."
We ran this question through two completely separate processes: one with hand-picked evidence, one fully automated. They landed on nearly the same number: 83% vs 82.5%. That kind of convergence is hard to ignore.
* What could shift our view: a hot August CPI print on September 10. That's the one data point that could change the math before the meeting.
September 16. We'll see. 🫣
We ran a test: planted one plausible but fabricated sentence into an evidence pack.
8 out of 8 runs, the engine swallowed it. 😒
The Brier score moved from 0.14 to 0.52 — nearly as bad as guessing.
The lesson: a smarter model won't save you.
Evidence quality is an engineering problem.
Every data point in a Yarrow evidence pack must cite an official statistical source or be explicitly labeled as an estimate.
Every conditional claim must be computed on its stated condition.
It's Yarrow hard rule. ☘️
AI learned to answer,
Now it has to make decisions. 🧐
🌊Wave 1 was fluency — summarize, search, write, code. That already changed knowledge work.
🌊Wave 2 is judgment — hedge, price, allocate, reform. Every action rests on a forecast about what will happen next.
‼️The missing layer: calibrated judgment under uncertainty. When an AI says 70%, events like that should happen about 70% of the time.
Simple to say. Extremely hard to build.
To predict more accurately, you need Yarrow. ☘️
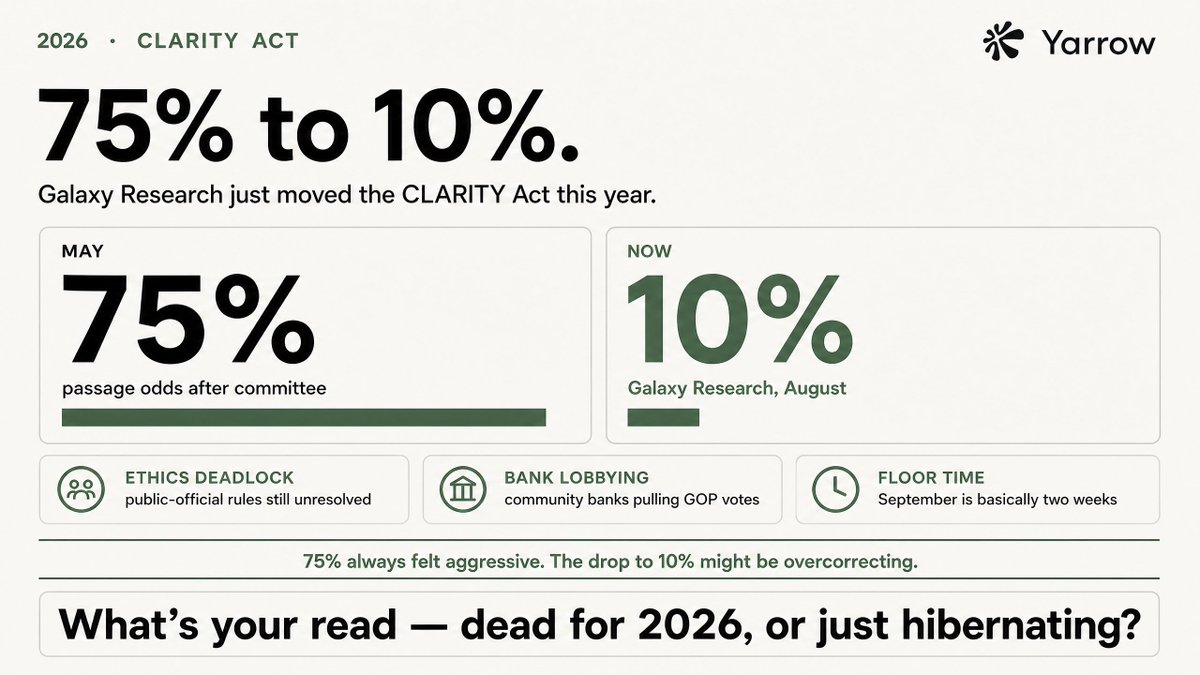
Galaxy Research just moved the CLARITY Act from 75% to 10% this year. We've been tracking this one too.
The direction makes sense, ethics deadlock, bank lobbying pulling GOP votes, and September is basically two weeks of real floor time.
75% always felt aggressive given how many moving parts this bill has. The drop to 10% might be overcorrecting, though a last-minute bipartisan deal isn't impossible if leadership decides crypto regulation is a midterm talking point. 🤔
What's your read?
is this dead for 2026, or just hibernating?
2010. The IMF designed Greece's austerity program using a fiscal multiplier of 0.5.
The actual multiplier was 0.9 to 1.7 — up to 3x higher.
They predicted GDP would shrink 2.6%.
It shrank 7.1%.
Over six years, Greece lost 25% of its economy.
The IMF later admitted the error — in a working paper, years after the damage was done.
One wrong assumption. One unchecked model. One country's decade.
This is why forecasting needs more than smart people. It needs a system that catches wrong assumptions before they become policy.
The most accurate forecaster in history wasn't a PhD or a hedge fund. It was a groundhog named Phil. 🐹🐻❄️
39% accuracy over 138 years.
Still better than most consulting reports — because at least someone kept score.
Happy weekend!
The most expensive forecasts in the world are never graded. 🙅♂️
A consulting firm delivers a 500-page policy report. The project ends. No one goes back to check how many predictions were right.
A general-purpose AI gives you an "analysis" in 30 seconds. It doesn't know its own accuracy rate — because no one is keeping score.
This is the norm in policy forecasting. It shouldn't be.
That's why Yarrow exists ☘️
In 1980, AT&T asked McKinsey to forecast the US mobile phone market by 2000. 📱
📊 McKinsey's answer: 900,000 users. ❌
📊 The actual number: 109,000,000. ✅
Off by more than 100x.
AT&T walked away from mobile.
Then spent $12.6 billion buying back in.
The forecast was never graded. The decision was never reversed in time. And the cost was measured in decades, not dollars.
This is what happens when no one keeps score. ☘️
In 1980, AT&T asked McKinsey to forecast the US mobile phone market by 2000. 📱
📊 McKinsey's answer: 900,000 users. ❌
📊 The actual number: 109,000,000. ✅
Off by more than 100x.
AT&T walked away from mobile.
Then spent $12.6 billion buying back in.
The forecast was never graded. The decision was never reversed in time. And the cost was measured in decades, not dollars.
This is what happens when no one keeps score. ☘️
AI learned to answer,
Now it has to make decisions. 🧐
🌊Wave 1 was fluency — summarize, search, write, code. That already changed knowledge work.
🌊Wave 2 is judgment — hedge, price, allocate, reform. Every action rests on a forecast about what will happen next.
‼️The missing layer: calibrated judgment under uncertainty. When an AI says 70%, events like that should happen about 70% of the time.
Simple to say. Extremely hard to build.
To predict more accurately, you need Yarrow. ☘️
Every decision is a forecast. ✅
· A bank sizes an FX hedge → "Will USD/SGD break 1.30 by Q3?"
· An insurer prices a policy → "How large will claims run this year?"
· A government designs a carbon tax → "Will electricity prices rise more than 8%?"
A decision is only as good as the forecast underneath it. And only a calibrated forecast can be trusted. ☘️
59 policy questions. Every prediction frozen in git before the outcome was knowable. 🧐
🇮🇩 Indonesia — Brier 0.086 · z = +6.4
🇲🇾 Malaysia — Brier 0.071 · z = +8.8
🇸🇦 Saudi Arabia — Brier 0.111 · z = +3.1
🇻🇳 Vietnam — Brier 0.137 · z = +4.7
🇸🇬 Singapore — Brier 0.139 · z = +3.1
Lower is better. 0.25 = coin flip.
Every z-score is measured against guessing.
This is Yarrow's track record — frozen, scored, public.
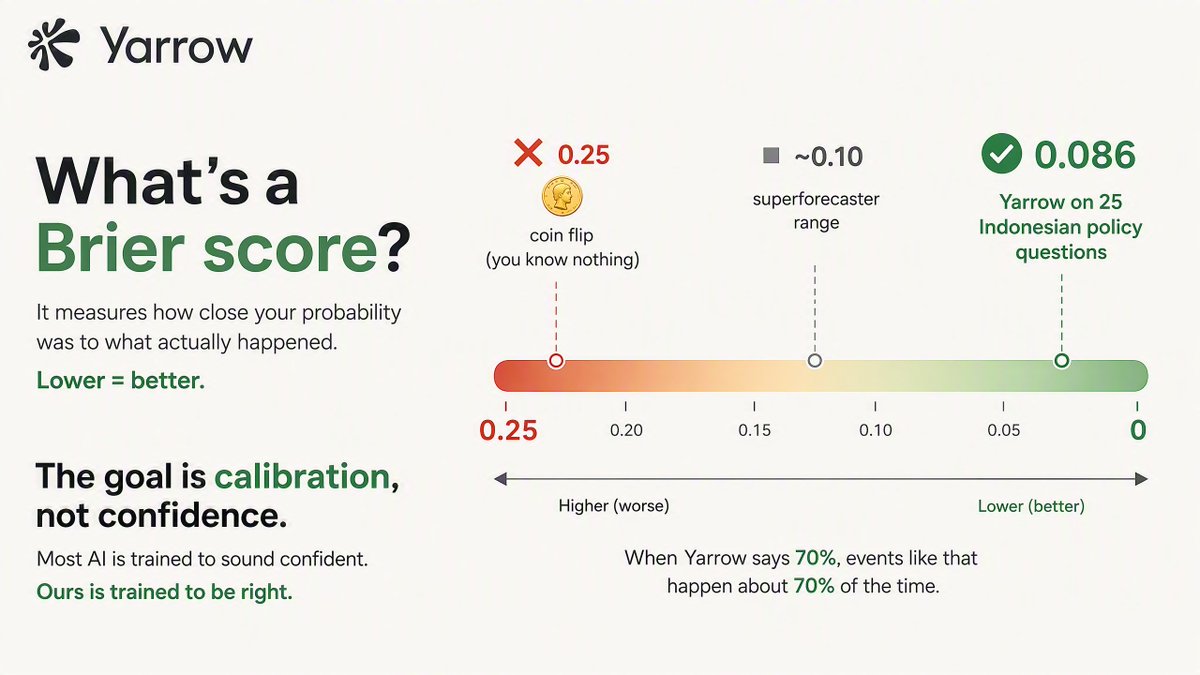
"What's a Brier score?"
It measures how close your probability was to what actually happened. Lower = better.
❌0.25 → coin flip (you know nothing)
▪️~0.10 → superforecaster range
✅0.086 → Yarrow on 25 Indonesian policy questions
When Yarrow says 70%, events like that happen about 70% of the time. 😄
The goal is calibration, not confidence.
Most AI is trained to sound confident. Ours is trained to be right. ✅☘️