I just started my journey into Data Analysis as a Biochemistry undergraduate.
I'm learning:
• Excel
• Data Analysis
• Python
I'll be sharing my progress step by step.
Follow along if you're learning too🤍
Yesterday, while returning from school, the korope I entered had to stop for fuel, but about three filling stations close to my bus stop were already shut down. Passengers started murmuring, and one man said fuel prices had just been increased again.
I got home and checked, and sadly, it’s true. Reports from credible Nigerian media platforms confirm that marketers are already adjusting prices after another increase in petrol costs linked to Dangote Refinery’s new ex-depot price.
For students and ordinary Nigerians, every fuel price increase equates, higher transport fare, more expensive food, increased school expenses, and more hardship for families already struggling.
As students, we feel it immediately. The same transport that cost one amount last week suddenly becomes unbearable. Some people now trek distances they normally wouldn’t. Some skip classes because transport money is not available. Small survival in Nigeria is becoming a daily battle.
What hurts the most is that Nigeria is an oil-producing country, yet citizens live in constant fear of the next fuel increase. Filling stations closing early, long queues returning, transport costs rising overnight, this has become our normal.
At this point, fuel price hikes are going beyond being just an economic news. They affect mental health, education, businesses, and the everyday survival of millions.
I pledge to Nigeria, my country, but a concerned Nigerian student is tired.🇳🇬
It may not look perfect yet, but the important thing for me was moving from just learning to actually building something.
I’m still learning and improving, and I’d really appreciate any corrections or suggestions🤍
• Which product category generates the most sales
• Which customer segment contributes the most revenue
• How sales have changed over the years
• Regional sales performance
@cheftee_lead The hardest part for me is consistency, self-doubt, and getting lost in too many resources, not knowing if I’m on the right path or what the next step should be.
I couldn't post yesterday because I wasn't feeling too good.
Here's a recap:
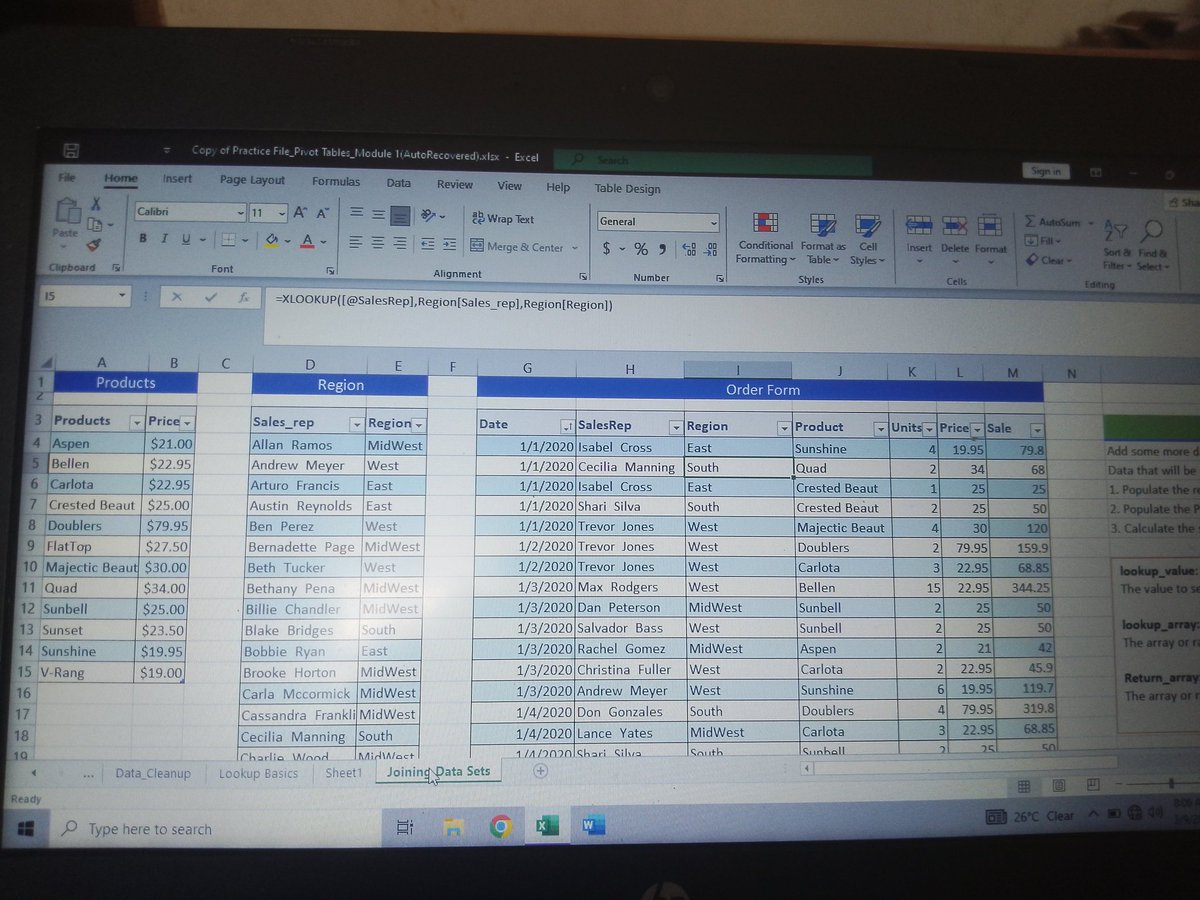
• Turned a list into a table using Ctrl + T and added a timeline to track data visually over time.
•Enhanced my pivot table by adding a calculated field and applying report filters for easier analysis.
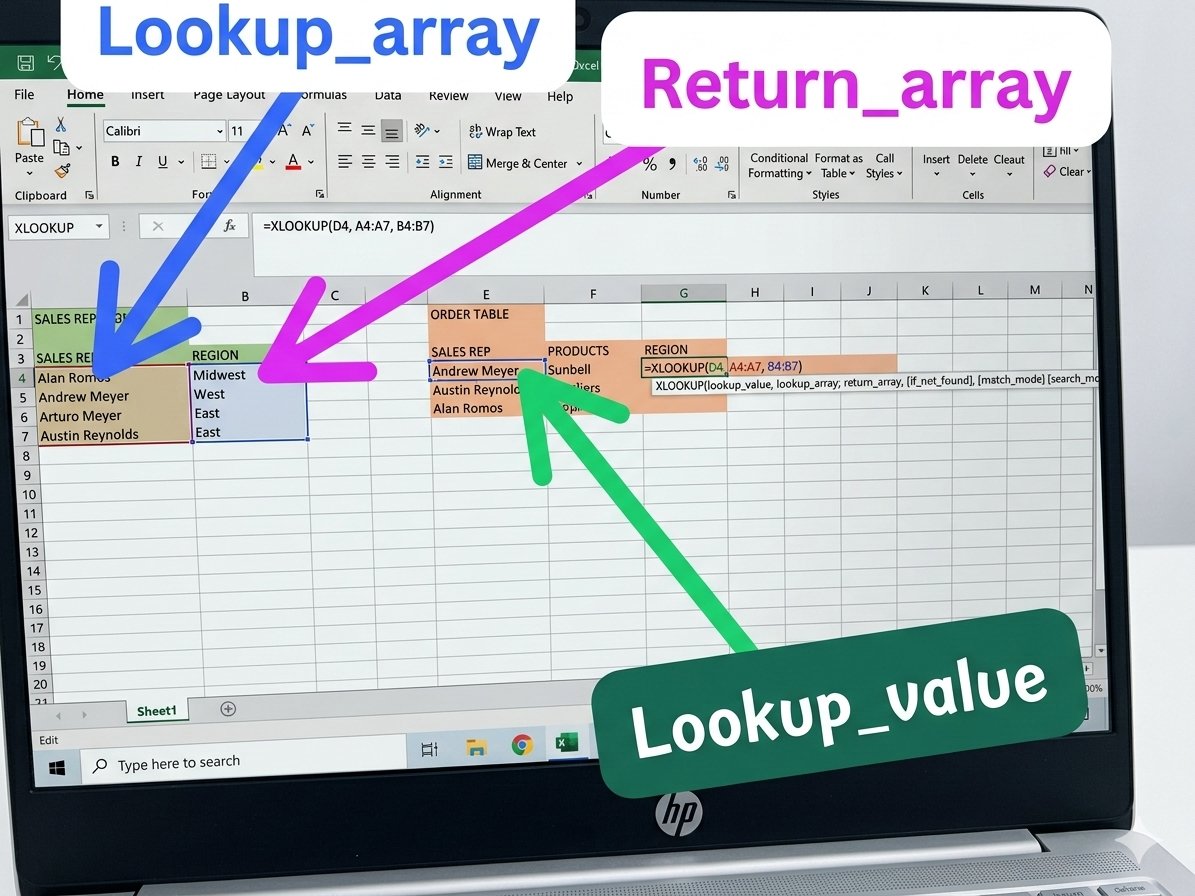
(1) Here are a few insights to know on Xlookup as a beginner in Excel like me
- Xlookup helps you find a specific value in a table and return the related information from another column. It's like asking Excel "Find this item for me and tell me the information connected to it"
Quick tips on Xlookup
• XLOOKUP can search both left and right.
• You don’t need to count column numbers like in VLOOKUP.
• You can add a custom message instead of getting errors.
• It works with rows and columns, making it more flexible.