Track key market zones with custom-built indicators. Track trends & spot setups across Equity, F&O, Commodities & Crypto. Not SEBI registered. Educational Only.
⚠️Disclaimer - Indicators highlight probable zones based on predefined conditions. This is not a recommendation. Final decisions remain with the user.
Note : Past performance does not guarantee future returns.
Long-Term Zone Approach
1. Long-Term Zones are meant for positional holdings 6-12 months
2. Follow a staggered buying approach at defined support levels.
Check Feb - Dec 2025 Performance - https://t.co/fyamUCUhcc
Note - This is shared for learning purposes & to illustrate how our long-term indicator zones are used. Check your risk appetite before investing.
Disclaimer - Not a recommendation. Do your own research before Buy/Sell. Holding some long term old qty.
Reliance at 1500-1450 : On Long-Term Yearly Indicator
Today down 5% due to News of Russian oil.
1. Currently at Yearly Pivot Zone - Last week made new High.
2. Historically, these zones have acted as important support levels for long-term structure
#Reliance@Zones_Indicator
More Panic accumulation Zone = 1350-1385
This chart is valid till 31st Dec 2026. Resistance Target = 1697 & 1795 (as per Zones)
Track good quality companies in Long term Indicators.
Simple Tools for Independent Trading, start tracking👍
#Reliance@Zones_Indicator
VOLTAS : Rally from Rs. 1239 to Rs 1490 💥💰🚀
Clean 20% Jump 💥✔️🚀
Now we have got New Yearly Zones. Attached Updated chart
Again timing done right. Shared here on 15th May 2025 ✅
Book partial profit with trail SL of Cost as per your comfort & risk, next resistance = 1664
VOLTAS : Tracking on Long-Term Yearly Indicator
Currently trading in its Yearly Pivot Zone — historically, these zones have acted as important support levels for long-term structure.
In Yearly Indicator chart, we have added Panic buying levels as well.
#voltas
Disclaimer - Not a recommendation. Do your own research before Buy/Sell.
This is shared for learning purposes and to illustrate how our long-term indicator zones behave during broad market corrections.
Check your risk appetite before investing.
Max Healthcare : On Long-Term Yearly Indicator
Trading in Yearly Pivot Zone. Historically, these zones have acted as important support levels for long-term structure.
Accumulation Zone = 1000-1070
Resistance Target = 1213 & SL = 958 (Small SL)
@Zones_Indicator#maxhealth
Risk : Reward in favour after current drawdown👍
Track good quality companies in Long term Indicators.
Simple Tools for Independent Trading, start tracking👍
#TradingWithZones
Another profitable trade as per Long Term Indicator ✔️✔️
@Zones_Indicator
LTIM : 20% Jump from Rs. 5130 to Rs 6162 🔥💰���
Shared in Indicator Premium Group on 22nd July.
First Target Hit 💥
Check Update shared on 22nd July 👇👇
Avoid random Trading in market.
#LTIM
📊 Yearly Zone Indicator in Action
✅ Support zones identified well in advance
✅ Stock rallied ~30% from Panic Support
✅ Now near pivot zones, preparing for the next move
Simple tool, Simple Usage 👍
We have shared this today in Long Term Premium Indicator Channel.
📌 Premium users have the right tool to spot panic zones, structure entries, and stay confident through volatility.
No FOMO 🙈
No Noise 🙉
No Random Trading 🙊
Simple Tools for Independent Trading, start tracking👍
🔼"Winning Wednesday"🔼
@Zones_Indicator
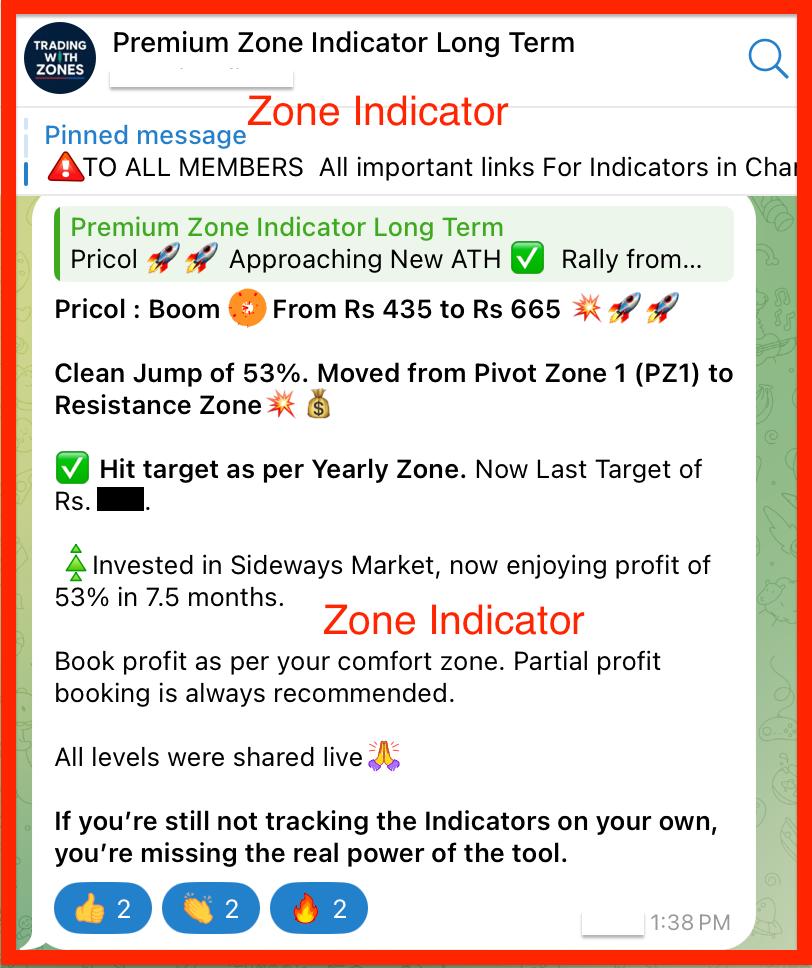
PRICOL : Hits New High & Yearly Zones 💥
Shared on 28th April & 17th July with clear Charts and Strong buying Zones.
53% Jump from Rs. 435 to Rs 635 🔥💰🤑
#Pricol#TradingWithZones
🔼"Thrilling Thursday"🔼
Booked Bumper Profit💥
Pearl Global : 43% Jump from Rs. 1350 to Rs 1932 🔥💰🤑
Shared in Indicator Premium Group on 24th Oct
📌 Premium users have the right tool to spot panic zones, structure entries, and stay confident through volatility
#PGIL
🔼"Thrilling Thursday"🔼
@Zones_Indicator
ICICI Bank : Bought as per Monthly Zones, 48 Points Booked 🔥💰🤑
_____________
Zone Indicators : It is a market trend analysis tool designed to provide insights into potential market direction.
#icicibank#ICICI#TradingWithZones
📌 Premium users have the right tool to spot panic zones, structure entries, and stay confident through volatility.
Avoid random Trading in market.
Simple Tools for Independent Trading, start tracking👍
#TradingWithZones@Zones_Indicator
Pricol : 35% Jump from Rs. 435 to Rs 586 💥
#pricol@Zones_Indicator
Holding from 28th April👍
New Breakout = New Target 💪✅
🔠 This is how Long-Term Zone Indicators help identify quality stocks at key support areas — well before the move begins.
#TradingWithZones