On Adjusting to Trending Conditions
Some qualifiers before the main content:
1. There's never a good time to post this stuff. People love to infer that any post is some form of market commentary or hidden directional 'signal'. It is not, just take it for what it is.
2. There are no chart examples. Too much trading 'education' is just cherry-picked charts with virtually no explanation. I'm at the other extreme; heavy on the substance but not gonna handhold you through hindsight examples. I trust/hope you can do that yourself if you really care. Or just watch TechnicalRoundup/my YouTube videos.
Right, onwards.
The specific goal of this post is to highlight how chart-oriented traders who are used to more 'orderly' market conditions can adapt their tools and systems to participate in markets with stronger trends.
Crypto goes through phases of 'lockout trends' where the market - especially altcoins - go up and keep going up without offering generic entries (also happens in the other direction but, erm, 4).
My definition of generic entries is entry techniques that are common in slower and/or rangebound markets: high(er) time frame failed breaks, sweeps/spikes, break-and-retest patterns, convenient candle closes at high time frame levels, and so on.
The aforementioned 'lockout trends' are characterised by the absence of those generic entries. Specifically, the market will usually go up via some combination of: i) straight line move up; ii) impulse, consolidate, impulse, repeat; iii) impulse, diagonal grind up, impulse, repeat; and iv) impulse, shallow pullback, impulse, repeat.
In most of those cases, if you're sat twiddling your thumbs on the daily/weekly/monthly time frames waiting for a textbook entry, you'll be waiting for a while. In fact, in many cases, the high time frame 'obvious' pullback only occurs much later when the trend is over, which is of little use to you.
This raises the following query: absent the textbook/generic high time frame price action entries, how can you adjust your approach to participate in a faster-moving environment?
I'm pulling this from a bunch of notes I made in 2018 (after 2017 uptrend) and early 2021, so the points are not in order.
If there's at least one useful thing that helps, I'll be satisfied.
1. Lower your time frames. There is no need to throw the baby out with the proverbial bathwater. If your trading system heavily relies on standard price action stuff (horizontal levels, ranges, failed breaks, sweeps/spikes, and so on) those tools are still viable. You just have to lower your time frames to adjust to trending conditions. If you've been using daily/weekly/monthly time frames and they just look like fat candles with 0 retracements, reduce your time frames to capture more intraday price action e.g. M5/M15/H1/H4. It's still helpful to know where the high time frame levels are in case there's a sharper flush etc. but generally post-breakout/breakdown and in between high time frame levels, the lower time frames are more useful.
2. Forget about macro retests in the medium-term. Big breakouts/breakdowns are a signal in and of themselves. It's tempting to overlay a Babypipsesque view of the market and assume that a retest would provide a good entry, but more often than not, the opposite is true. Specifically, pulling back immediately after a large break ought to be treated with suspicion. If the breakout/breakdown is strong, it really shouldn't look back or at the very least shouldn't linger around the break level. There's a pervasive fiction that a retest somehow 'confirms' the break, but this is simply not true.
3. Post-break pullbacks must generally be shallow in a strong trend. This is a logical corollary of point (2) but worth stating on its own. Strong markets offer pullbacks, but they tend to be more shallow. A recurring pattern is the following: Breakout --> "I'll buy the pullback" --> Market pulls back --> "Nah, bit more, the obvious HTF level is further away" --> Pullback ends --> Continuation. If the trend is strong, pullbacks will generally be shallow and not retrace all the way to the origin of the break. The only worthwhile exception to this is macro trend pullbacks e.g. the consistent 30-40% pullbacks in BTC during long uptrends, but even those don't typically go all the way back to where the trend was formed. Practically, this means using closer and/or lower time frame levels of support on pullbacks to position for continuation.
4. Consolidations are a form of pullback. I've written and spoken about this extensively, so I will not labour the point here. As mentioned, strong markets will often avoid pulling all the way back to the origin of the break and instead trend via impulse --> consolidation --> impulse or some variant thereof. Therefore, consolidations are a form of pullback i.e. means of getting an entry. These consolidations are great for marking out lower time frame ranges (among other tools, to be discussed) and using them for entries.
5. Normally mediocre levels work better in a strong trend. Bit of an esoteric point, but if you've spent enough time squiggling on charts, you should intuitively know the difference between 'that level is a banger' and 'mehh maybe it'll react there but it's a bit of a reach'. In a strong trend, the otherwise mediocre levels get a 'boost' of sorts to their efficacy if they're in line with the trend itself. In other words, meh support + strong uptrend = strong(er) support / meh resistance + strong downtrend = strong(er) resistance. One way to conceptualise this is that market participants have 'lower standards' when they're trend following.
6. Fast-moving MAs are very useful dynamic support/resistance levels. The exact MA configuration is less important. Binance default MAs, 13/21, 50/100/200, some sort of band/ribbon, Bollinger Bands, whatever. In 'lockout trends' the market spends a lot of its time in the middle of nowhere (from a HTF S/R perspective) and as a result there is greater order herding around these uncontroversial 'consensus levels' like MAs. Failed breakdowns at fast-moving LTF MAs and/or retests of slightly slower-moving MAs are solid areas to look for trend continuation.
7. LTF momentum resets and divergences are very useful entry techniques. Again, with lockout trends and in the absence of obvious HTF levels, the TA gets a lot looser. Especially if left curve tourists are aping the market, basic stuff works very well. Most momentum indicators/oscillators (RSI and others) generate 'reset' signals e.g. RSI bouncing from/reclaiming 50 level. These can provide 'okay this has cooled off'-type entries even if the cooling off didn't reach an obvious S/R level. The same applies to momentum divergences, ideally in line with the underlying trend e.g. LTF bullish divergence in uptrend/LTF bearish divergence in downtrend. Simplest of all, even basic overbought/oversold signals on lower time frames become surprisingly viable if the trend is strong enough. Note that these techniques aren't mutually exclusive, I'd encourage you to look for confluence where appropriate. You can build a surprisingly robust LTF case for an entry based on MAs, momentum, LTF range etc. even if the HTF chart looks like it's nowhere meaningful.
8. Liquidations are a valid form of pullback. This is the standard washout/flush trading trope. Basic premise is that aggressive punters trying to catch the trend have been forcibly removed from the market, and the dislocation caused by their liquidation(s) makes for a good entry. Specifically, you want to see sharp OI declines alongside sharp increases in liquidations that line up with the dominant trend i.e. long liqs in uptrend to provide a dip to buy/short liqs in downtrend to provide a rip to sell. This does work the other way around too but it requires some degree of chasing and it's more nuanced. I will also note that exceptionally large liqs/OI wipeouts tend to be trend-reversing as opposed to a precursor to continuation, so ideally if you're using liqs for continuation setups they should be noticeable but not some mega multi-month market-wide wipe if you're trying to trend follow on lower time frames.
9. Price action pivots are your friends. Even if the HTF S/R levels are absent or of limited use, some standard price action concepts can still be very useful for 'grounding' you or adding context. Specifically, in no particular order: Daily Open, Weekly Open, Previous Day's High, Previous Day's Low, Previous Week's High, Previous Week's Low. I have videos on all of those on the Cred YouTube channel, so I'll spare you the repetition. They're a good way to get something when the HTFs are showing nothing. And they work, because everyone is looking for something (recurring theme here).
10. Relative strength & relative pairs are always relevant. By relative strength, I mean how your coin is holding up relative to BTC/ETH as well as the broader market. It is generally easier and more fruitful to long the strong stuff until it stops being strong rather than trying to be 'early' to the next narrative or longing the laggards hoping they stop lagging. This exercise is especially useful on down days - assess which coin(s) are down less than the others (or are perhaps even green) and you can infer with reasonable accuracy that strong coins during market weakness will be even stronger during market strength. As far as relative pairings, aside from making sure your assets are outperforming BTC/ETH, the ALT/BTC charts can provide contextual clues and offer S/R levels even if the ALT/USD chart is in the middle of nowhere. More colloquially, if you're desperately trying to grasp at some S/R level but the USD pair is far away from anything meaningful, check the BTC pair. This can also apply to specific pairs e.g. SOL/ETH recently, but ALT/BTC is generally a good starting point given there is often more price history to work with.
11. Don't ignore BTC/ETH. It is tempting to dispel the slow, boring, boomer coins from your watchlists if alts are trending and focus on the lower cap stuff instead. Even for pure altcoin punters, BTC/ETH are very useful tools. Not only for the reasons stated in (10), but also because the crypto market is still very tightly correlated for the most part. If BTC/ETH meaningfully pull back, there's a good chance your altcoins pull back as well. Correlated pullbacks can provide clear, risk-defined entries on altcoins that have locked you out and don't have any clear HTF levels nearby. Simplest example is waiting for BTC/ETH to pull back to support, and buying the altcoin(s) of your choice once you get a valid long trigger on BTC/ETH. Paying attention to BTC/ETH can also serve as a decent 'reality check' so you're not tagging on a ton of blind altcoin risk at potential market-wide sticking points.
That's most of it, I think.
Again, there's never a perfect time to make a post like this: if I do it during low vol chop then nobody cares, if I do it now, it's seen as some sort of prognostication of future conditions. I don't know what the future holds, just wanted to get this piece of content out of the way so I can refer to it if/when appropriate.
Thanks for reading if you made it this far.
I ain't reading all that. I'm happy for u tho. Or sorry that happened.
Market Update (Nov 22 2023)
• $BTC and $ETH analysis and trade ideas
�� Discussions on multiple level tests, candle wicks vs. closes, and how to trade it all
• My overall thoughts on market, ETF, etc.
In partnership w/ @PrimeXBT
RT appreciated!
https://t.co/AvnnUNNVm8
PRICE ACTION ENCYCLOPEDIA 💯
Complete Price Action Trading Course.
Every Single relevant PA Concept Covered for Crypto and Forex.
Link - https://t.co/kuQuoAYZbf
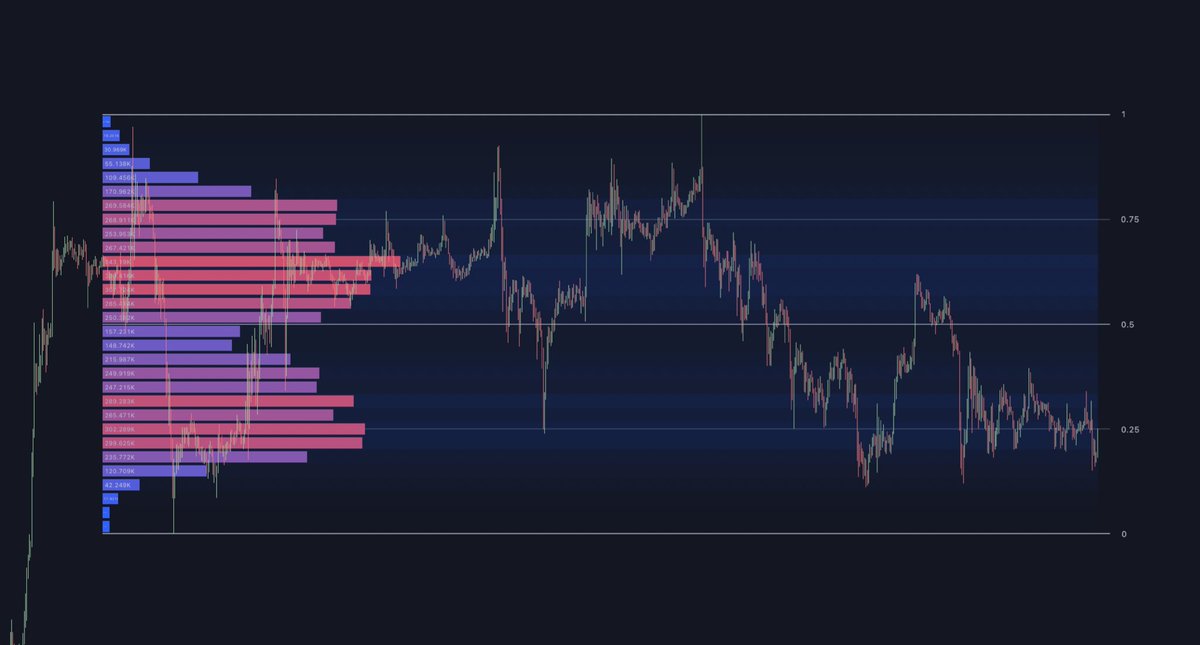
My free interactive Range Analysis indicator is now live and it can be a game changer for your trading.
• Auto Range levels
• Volume & Open Interest profile
• Volume & OI heatmap
• Anchored VWAP
• much more
Retweets are very appreciated!
1/5
Interactive Range Analysis
Working on a new script, probably one of my favorites.
It will include:
• Range & level detection
• Volume and Open Interest Profile
• Stats, Market Structure
• Liquidation levels, VWAP & more
Beta testing soon, retweet if you’re interested :)
Market Sessions Indicator
A simple script to help you keep track of market trading sessions.
• 4 Sessions (defaults: Tokyo, London, New York, Sydney)
• 4 ways of displaying sessions
• Useful functions (merging, levels, etc)
Retweets are appreciated!
https://t.co/qKoIr8bcOo
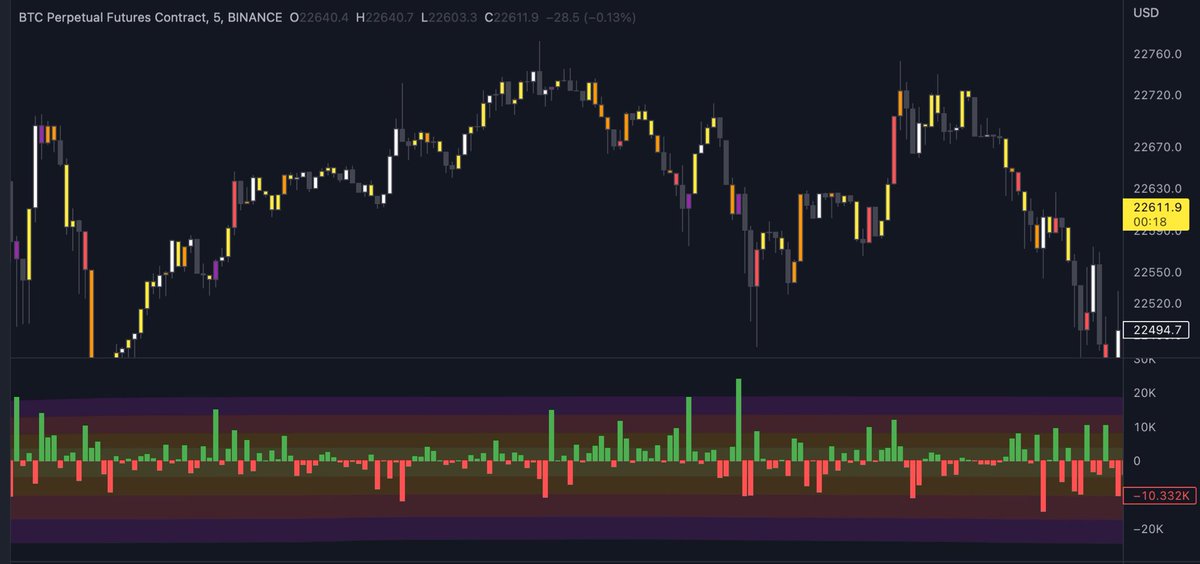
Open Interest Delta indicator
I’ve just published a new Tradingview script that plots the change in Open Interest + draws a heatmap and colors candles to help you identify where large OI increase/decrease occurred.
Retweets are appreciated!
🔗 https://t.co/a7VE4dJe2s
There is still millions of dollars worth of $renBTC in these @CurveFinance pools that will literally become WORTHLESS tomorrow once they can no longer be bridged.
Please share so people can remove their liquidity and bridge to native $BTC.
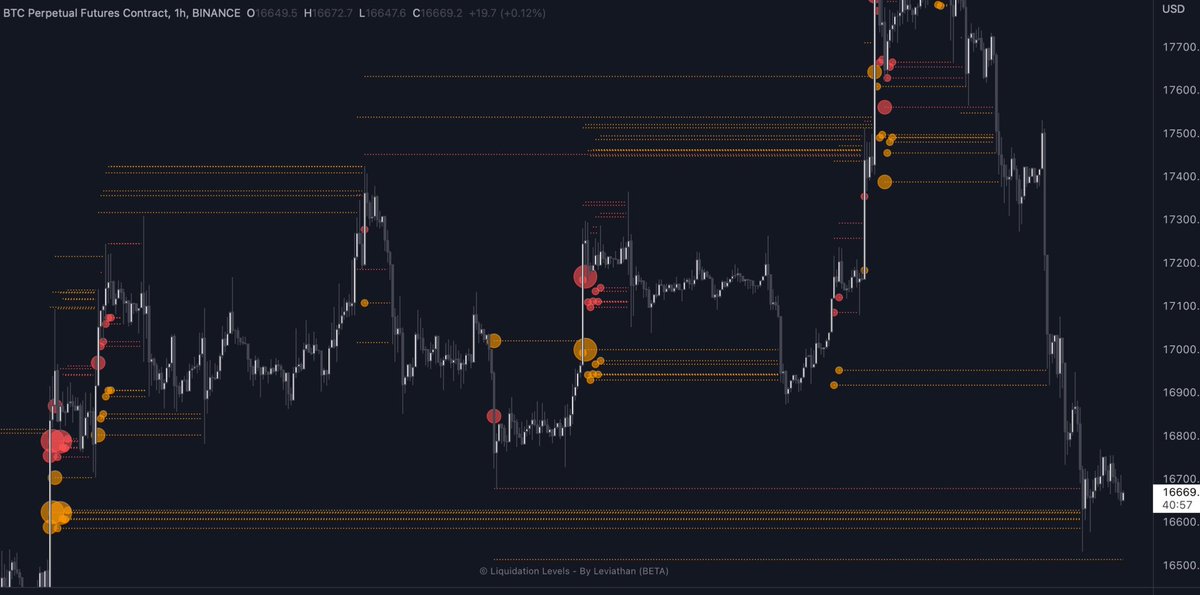
Show some support to this tweet & I will drop the “Liquidation Levels”indicator on Monday, December 19.
Liquidation levels, visualized market order activity, leverage ratio and many more useful metrics & tools.
It works on all assets and on all timeframes.
All for free.
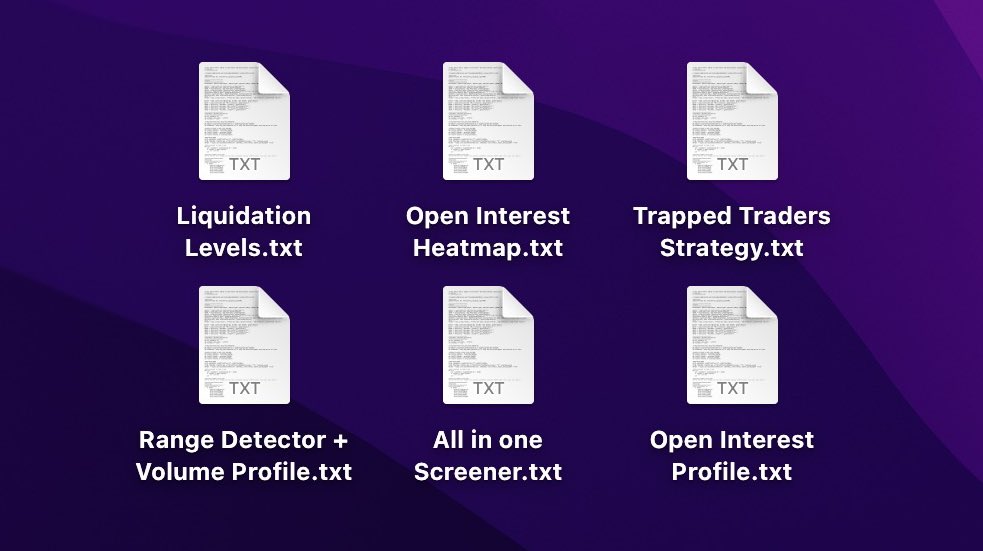
Here are some Tradingview indicators that I’m working on right now.
They will all be published for free!
Drop a like/retweet if you want them and let me know which one are you most excited about :)
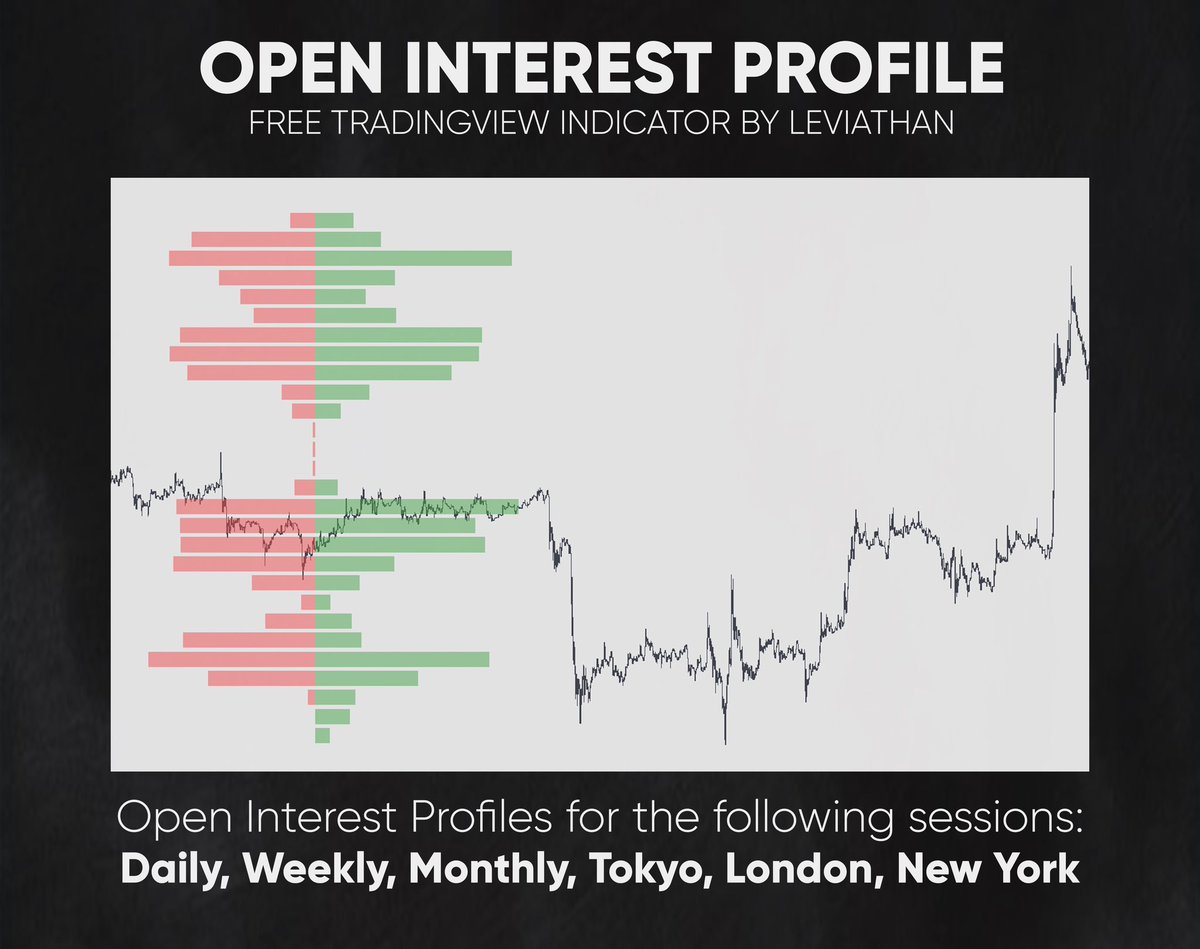
Free Open Interest Profile indicator
I’ve just published my new Tradingview script that shows OI Profile for
• Daily, Weekly, Monthly session
• Tokyo, London, New York session
PDF about OI and how to use it coming soon.
Retweets are appreciated!
🔗 https://t.co/UGs9jCbkZl
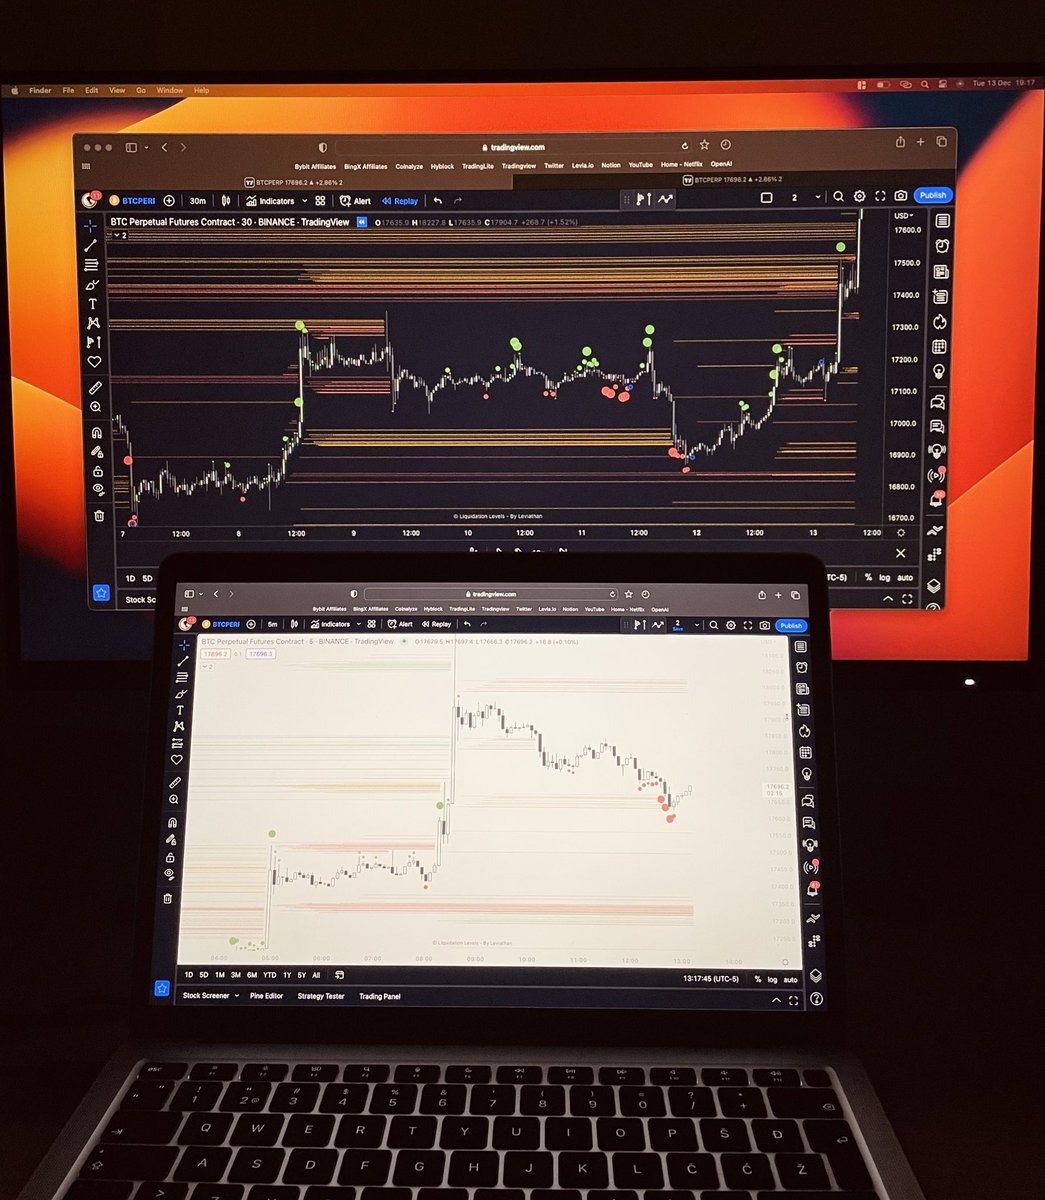
Liquidation Levels Indicator
This script predicts liquidation levels of over-leveraged traders & gives a deeper insight into the market (analysis of Open Interest, “CVD”, etc)
Almost finished & ready to launch.
I will pick 20-50 people who retweet this to be early testers.
There is circumstantial evidence that $5B AUM @ambergroup_io is insolvent, in distress, or rugging.
Unconfirmed 🇨🇳Chinese social media reports from @TechFlowPost support the on chain evidence of them dumping assets due to distress: https://t.co/088QuKjmuv
���👇