No, it won't be a problem.
This is why nobody should worry about the math IQ of Wayne State staffers like @jentaub:
The five new Democratic trifecta states (PA 19, MI 15, AZ 11, WI 10, NV 6) could, in theory, supply the remaining 48 electoral votes.
Now, let's model for each state an independent probability of enacting the compact by the relevant 2028 deadline (roughly mid-2028 / the July 20 determination date).
Then, let's apply two additional confounding variables:
a) The probability of no major withdrawals by existing members that drop the total back below 270;
b) The probability that, even if the threshold is reached, legal challenges (primarily Compact Clause and related structural arguments) do not prevent the compact from actually governing the 2028 election.
The image below shows state-by-state base probability in the new Democrat trifecta states (2026).
Results: Probability the five states collectively add ≥48 EVs: ~4%
After adjusting for withdrawal risk (~8%) and the substantial chance that litigation blocks or delays application to 2028 (~55% reduction): ~1.8–2% in the base case.
Why the odds are low:
The combinatorial problem is severe. You need several specific large states to all act, and the historical base rate for these exact states (when they previously had the chance) is poor.
Even a clean legislative path then faces a high likelihood of multi-year litigation that is unlikely to be resolved in time for the 2028 election to be run under the compact rules.
Q: What's the evidence for this assumption?
A: Michigan held a Democratic trifecta in 2023–2024 and did not pass it. Nevada’s Democratic governor vetoed the bill in 2019, citing concerns that it would reduce the state’s outsized influence as a swing state. Similar worries about losing campaign attention have been voiced by some Democrats in battleground states.
Then there's the litigation element, which protracts timelines for enactment far beyond the 2028 elections.
Again, this is why nobody worries about @waynestate professors developing nukes or solving string theory.
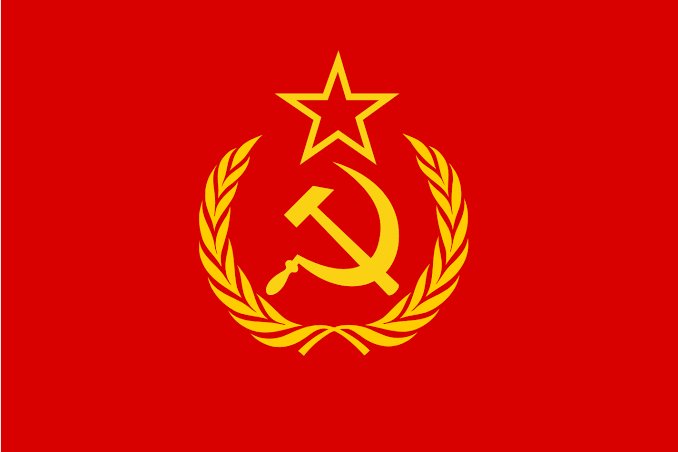
The red star and the hammer-and-sickle were related but often independent Soviet symbols.
Military vehicles and equipment: The official national identification mark was often a red star (sometimes outlined or with tools inside). Stars were sometimes avoided on armor because they served as aiming points for enemy gunners.
Uniforms, caps, and pins: Cap cockades and many insignia featured a red star, frequently with the hammer and sickle inside or associated with it. Standalone hammer-and-sickle pins and badges also existed, especially for party or labor themes. Small size led to simplified designs, but the star remained a frequent element on military items.
Documents, stamps, and small emblems: The full state emblem (globe, wheat, hammer and sickle, star on top) was used when space permitted. Simplified versions or just the hammer and sickle appeared on some seals, posters, and printed matter.
These real variations explain why someone might recall hammer-and-sickle symbols without an accompanying star in certain military or graphic contexts.
Mark Zuckerberg:
a) has clearly never had a Guinness before;
b) is calculating - in real time - the likelihood that he's been pranked or poisoned;
c) is quickly relieved as he concludes that Guinness looks disgusting because it is disgusting;
d) smiles as he quietly makes an analogy to Scandinavian Lutefisk.
Further context, which explains the high likelihood of the above scenario:
"Between 1942 and 1951, the Federal Reserve ceded its authority to set interest rates to the U.S. Treasury, pegging the yield on long-term Treasuries at 2.5%" to help pay down the national debt in the aftermath of World War II.
https://t.co/lQr7hSKga0
A plausible scenario:
If the Fed imposes T-bill and long-term bond yield caps of ~1% after the 2026 midterms, in 5 years (by 2031) the USD will have likely lost at least ~33% of its 2026 value. This would mean T-bill and long-term bond holders will see those assets depreciate in value by ~27%.
During the Truman Presidency, this was known as the Fed's "Bond Support Policy". @balajis
In other words, under this scenario the same folks that repeatedly voted for Federal deficit spending from the 1980s onward (also the biggest beneficiaries of the current financial regime as they retire) would have effectively paid off the national debt largely by themselves:
https://t.co/hY3wtCnt3j
@jaybronious Brittany Romano is a literal parody of the famous SNL skit, "Girl You Wish You Hadn’t Started a Conversation With at a Party":
https://t.co/9wfSyA4nId
Absent $500 Billion per year in budget savings earned by cracking down on entitlement fraud, it's very hard to see how this ends without gold-backed crypto (e.g., XAUT) and BTC becoming the new de facto global reserve currencies.
Well done @QTRResearch:
https://t.co/wjyz5F6PES
We asked SuperGrok:
"In the past 10 years, how much value (in real terms) has the USD lost?"
The answer should bury Keynesian economics once and for all, @LPMisesCaucus@balajis@whatifalthist@jeffreytucker@AEI:
-------
Thought for 1m 0s
There is no single "percentage" for the USD's real value loss over the past 10 years (roughly May 2016 to May 2026), because it depends on the basket of goods, assets, or currencies you measure it against. Different categories show very different results.
Here is the most accurate, data-driven breakdown using official and market sources:
1. Consumer Goods & Services (Official CPI-U — the standard "purchasing power" measure)
Cumulative inflation: ≈38.75% (average annual rate ≈3.33%). $1 in 2016 has the same buying power as ≈$1.3875 today.
The USD is now worth ≈72% of its 2016 value for everyday consumer items (groceries, rent, services, etc.).
→ Lost ≈28% in real consumer purchasing power.
This is the BLS official figure most commonly cited for "inflation erosion."
2. Gold (classic hard-money / inflation hedge benchmark)
2016 annual average: ≈$1,249–$1,250 per ounce.
May 2026: ≈$4,500–$4,550+ per ounce (recent spot prices).
Gold price increase: ≈260–264% (roughly 3.64× higher).
The USD is now worth only ≈27–28% of its 2016 value against gold.
→ Lost ≈72–73% vs gold.
3. Real Estate / Housing
U.S. median home sales price: ≈$233,800–$250,000 in 2016 → ≈$403,200 (Q1 2026).
Nominal increase: ≈70–75%+ (varies by source/index; national indexes like Case-Shiller show even stronger appreciation in many markets).
After adjusting for CPI inflation, real home prices are still up significantly.
The USD is now worth roughly 55–60% of its 2016 value against housing.
→ Lost ≈40��45% vs real estate.
4. Commodities & Energy (broad indices like CRB)
Volatile and mixed.
Many commodities (especially energy and metals) have risen faster than CPI in recent years, though 2016–2026 overall performance varies by item.
Broad commodity indexes are generally up more than official CPI → USD lost additional ground (often 20–50%+ in real terms depending on the specific commodity).
5. Real GDP ContextReal (inflation-adjusted)
GDP has grown ≈25% cumulatively over the period (from roughly $19T–$20T to ≈$24.2T in chained 2017 dollars). This means the economy produces more real output, but one dollar commands a smaller share of that larger pie after inflation. It does not change the purchasing-power math above — it just shows the dollar’s erosion happened alongside economic expansion.
Bottom Line
Official consumer basket (CPI): USD worth ≈72% today (lost ≈28%).
Hard assets (gold, housing, many commodities): USD worth 25–60% today (lost 40–75%).
Foreign currencies: Roughly stable.
If your "basket" is mostly everyday spending, the dollar has lost about 28%.
If it includes real estate, gold, or other stores of value (as you specifically asked), the loss is substantially larger — often 50–75% depending on the asset.
This is why many people feel inflation has been much worse than the official numbers suggest.
These figures are based on the most recent available data as of May 2026. Exact percentages shift slightly with the precise start/end dates you choose.
Let me know if you want a deeper dive into any specific category (e.g., energy, stocks, college tuition, etc.)!
---- end SuperGrok reply ----
This is very clever on the part of @FBIDirectorKash, because it serves as a mental and digital media bookmark for everyone to revisit his jaw-dropping interview with @seanhannity exposing Crossfire Hurricane, and which featured a half-empty bottle of @WoodfordReserve sitting behind the host.
Really, the question is whether Don Lemon thinks the 1st Amendment allows one to hijack an entire private enterprise (e.g., a church), chase the patrons out by screaming at their children, seize the property and then use it to broadcast defamatory slander against the patrons.
The crime ring should really be rebranded 'Tren de Oswego': a network of foreign migrants who defraud HHS and its healthcare subsidies en masse.
The crime ring's epicenter is Lake Oswego, OR.
https://t.co/3FcWrLQSrC
🚨 BREAKING: Portland Police @ChiefBobDay just confirmed @DHSgov was right: the suspects are connected to Venezuelan gang Tren de Aragua and are implicated in a July 2025 shooting in Portland.
This was NOT an innocent “married couple,” despite what Democrats claimed. Shame on the politicians who spread false information to stoke fear, undermine law enforcement, and score political points. You owe the public the truth and a public apology.
A couple of PACER and OJCIN searches (the latter requires government or OSB participant access @Real_EdDiehl) will reveal the law firm at the center of 'Tren de Oswego': Buckley Law, P.C. (HQ: Lake Oswego, OR) which assists and represents an enormous number of migrant-owned "healthcare service companies" in their efforts to hoover up HHS disbursements under fraudulent pretenses.
Even Marion County which includes Salem, the state's capitol and where the Oregon Court of Appeals and Oregon Supreme Court are located, is a red county.
This is remarkable. @KatieDaviscourt@MrAndyNgo
Look at this map.
Outside a few big blue counties, Oregon is overwhelmingly red.
We didn’t lose the governor’s race by some massive mandate, we lost by 66,727 votes. That’s it.
Here’s what the turnout actually looked like:
Republicans: ~82.8% turnout
Democrats: ~78.5% turnout
Non-affiliated voters (Oregon’s largest bloc): ~44.5% turnout
At the same time, Oregon has 200,000+ eligible voters who aren’t registered at all — across the state.
Tina Kotek’s leadership has been failing Oregonians, and she’s consistently ranked among the least popular governors in the country. That frustration is real, but frustration alone doesn’t change outcomes. Action does.