After a month of open Beta optimising we are now officially live!
More than 18.000 checkins and 8000 reviews battletested our mobile app!
Available for download on iOS, Android and @solanamobile
Let's get into it 🧵
Ignore this at your own risk.
(lazy folks keep scrolling)
Tell me you didn't miss third day of recovery program.
Honestly, I don't know what hurts more.
Being down big.
Or getting rekt and being too lazy to make it back.
I lost millions before and know how it feels (it sucked).
But now after becoming multimillionaire, it's my responsibility to send the elevator down.
Which is exactly why I'm doing this community training.
My team and I are giving you full guidance to rebuild your confidence and recover losses for entire month.
Cost is zero american dollars.
Still some seats left but running out fast.
Stop wasting your time or you'll never get it back.
1. Go to 👉 https://t.co/bdlyWpmgCN
2. Claim your 30 days of free access
3. Connect your Discord account
4. You’ll be automatically added to our exclusive Discord channels where the magic happens.
Come and see with your own eyes.
P.S. Thanks for sharing this post for others to see.
Happy Sunday legends
Weekly & daily thoughts on $BTC as shared with members @TheBirbNest
Wishing you all a blessed Sunday & don't forget to take part in our free 30 day recovery programme especially if you took a hit in the recent drop.
More info 👇
https://t.co/kLh7TkvqXq
----------
DAILY REPORT
BITCOIN
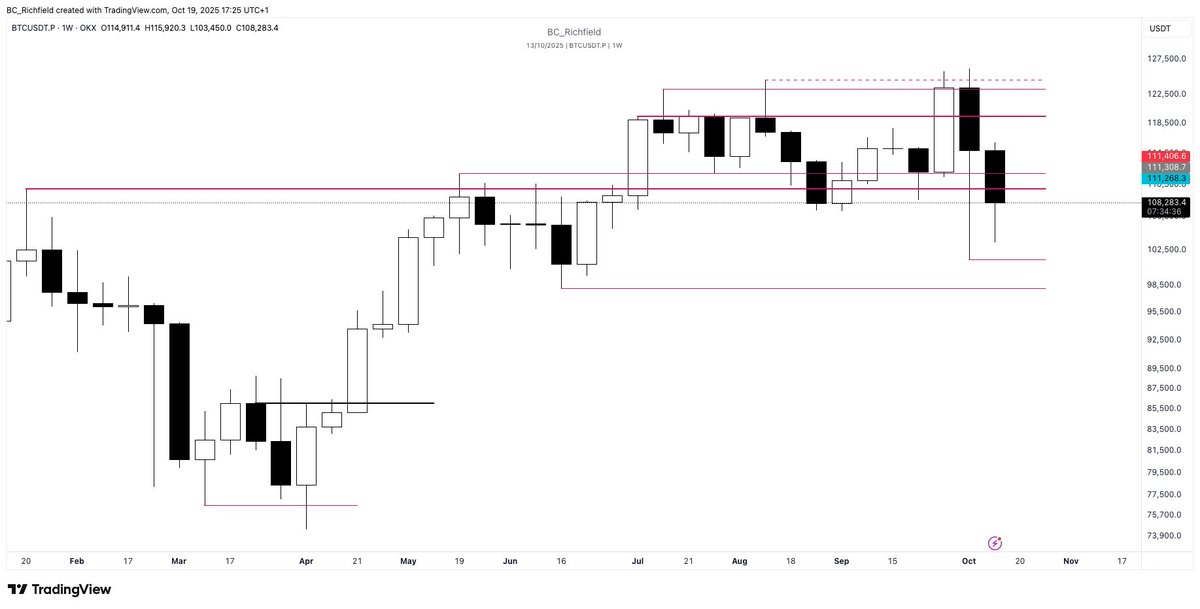
HTF 1W:
Price looks likely to close below January’s high, also a previous all time high (ATH) shown by the lower thick red line. I see this a continued sign of weakness in the short-medium term with buyers stepping in tentatively as we failed to follow through on last weeks recovery where buyers were more aggressive.
Should price close below Januarys high then a move down to the previous weeks low and possibly the swing low (lower thin red lines) seems likely. However, on the positive side, considering the sell off in risk assets last week and the major hit to crypto, price could well be lagging behind the indices (NASDAQ/S&P500) in its recovery - we saw the NASDAQ reclaim almost the entire pull back from the previous weeks sell off.
The caveat here is that we still need to see some key levels reclaimed as well as a shift in lower timeframe structure for more aggressive plays. We’ll look at these next.
DAILY REPORT
BITCOIN
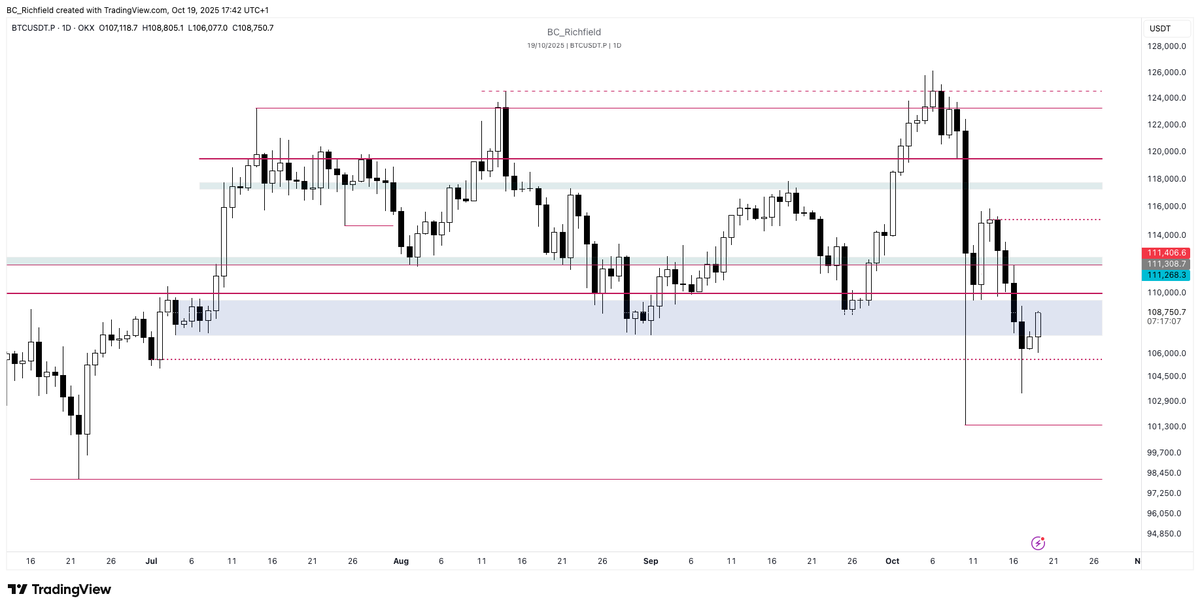
HTF 1D:
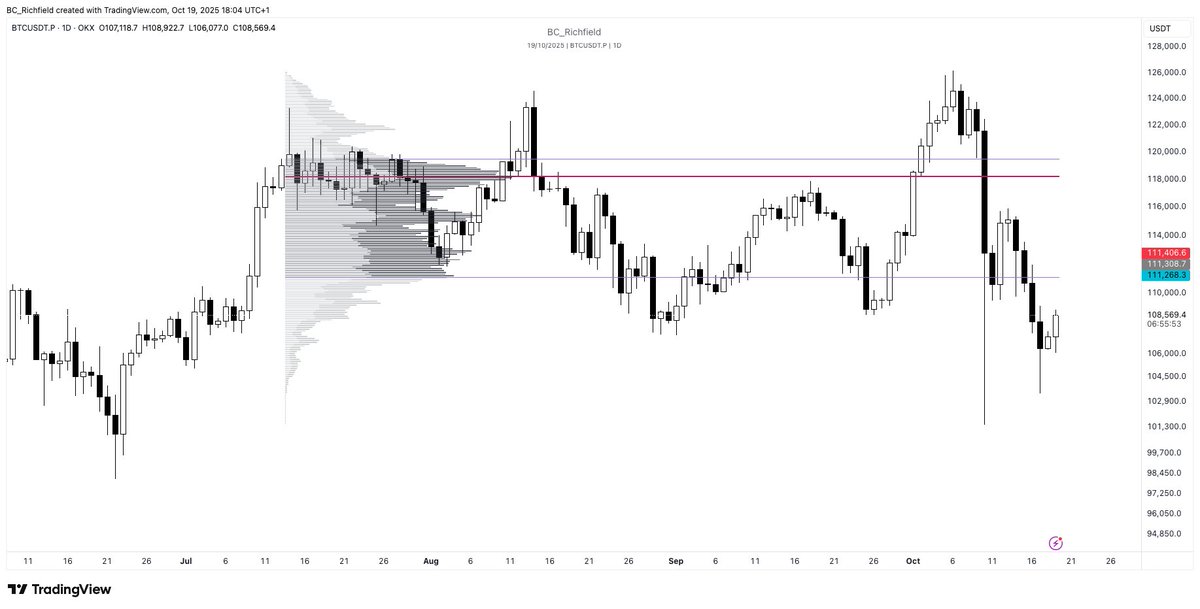
I’ve kept the prior ATH’s on the chart along with the green/grey areas above which shows the key pivot/support-resistance flip and the blue box below which was our target demand area or order block (OB) which lead to previous moves higher.
Our playbook is a tale of two dotted lines. The one below price and the one above. Both of these areas are key points of interest (POI) if and when price closed below/above them. Lets add some context.
The demand zone ( blue area) that supported price several times since it was set on July 10th is key to the short term plan.
From a bearish perspective this could offer strong resistance now unless reclaimed quickly because failure to do so could be an indication that sellers are still in control and buyers aren’t willing to step in with conviction at this level. The lower demand area (not shown by a blue area but consisting of the two consecutive bearish candles below the blue area), the bottom body of which our dotted line is anchored to, is doing its best to keep price supported and heading back above Januarys high, but it has a battle on its hands.
Should price close below this dotted line then the bastion of support for the bulls will be breached and any longs could be forced to close out/cover and therefor add the downwards pressure or at least remove the support. From here we turn to the lower targets outlined in the weekly plan.
The key battle grounds for the bulls are getting above Januarys high, reclaiming the daily demand area and most of all closing above the upper dotted line. This is the last area bears took control from the bulls and price closing above will be an indication of strength and we could reclaim market structure at the same time.
While this involves buying higher, it’s the safest plan in my opinion and one that would also see price reclaim the upper range low and value area low (VAL) giving a high probability of continuation higher towards the range high and value area high (VAH).
Remember the equity markets, dollar index (DXY) & VIX can offer confluence here too as weakness in the dollar & safe-haven assets can be positive for risk-assets like Bitcoin and Cryptocurrency, as can a low and falling VIX. So make sure to keep an eye on those as well as high impact news releases this week.
Have a great evening and I look forward to seeing you around the Nest next week.
Calm before the storm?
BTC ranging at $110K, miners near breakeven, volatility waking up. October's quiet starts end loud.
Here’s what’s brewing.
(Thread)🧵
Shocking stat of the day:
The top 10% largest US stocks now reflect a record 78% of market cap for the US stock market.
This exceeds the previous record set in the 1930s by 3 percentage points.
This is also above the peak of the 2000 Dot-Com Bubble, when the percentage was 74%.
By comparison, in the 1980s, the weight of the top 10% was below 50%.
Meanwhile, the top 10 stocks as a % of the S&P 500’s market cap is at a record 41%.
The market has never been so concentrated.
Investors are taking massive profits:
Professional, retail, and hedge fund investors sold -$3.8 billion in US equities last week.
Institutional investors sold -$1.4 billion, reversing to net selling for the first time in 3 months.
This brings down the 4-week average of buying down to +$1.6 billion, according to BofA data.
Hedge funds were also net sellers at -$2.0 billion, following -$2.9 billion the prior week, pulling their 4-week average down to -$1.0 billion.
Meanwhile, retail investors sold -$300 million, posting their 3rd consecutive weekly outflow, after -$800 million in the preceding week.
Wall Street and Main Street are cashing-in gains.