Spent the last two weeks building a trading bot. First strategy just lost 25% over 2 years of data.
Best outcome I could have asked for. Here's why.
What I actually built is not a bot yet. It's a lab for killing trading ideas fast.
Four parts, each does one thing:
Data - pulls candles and funding rates from exchanges, stores them locally, checks for gaps.
Strategy - reads candles and marks entries, exits, stop distances. Knows nothing about money.
Backtest - walks bar by bar like it's live. Fills on next open, checks stops against the wick, charges fees, slippage and funding. No peeking into the future.
Report - turns the trade list into metrics, equity curve, walk-forward windows and parameter grids.
Strategies will come and go. The engine stays. That's the asset.
First test subject: Donchian breakout. Buy when price breaks the 20-bar high, sell when it breaks the 10-bar low. BTC and ETH, 4h candles, 1% risk per trade. The oldest trend-following idea there is.
Results over 2.3 years:
271 trades
Win rate 25.8%
Avg win 2.25R, avg loss 0.89R
Max drawdown 39%
15 losing trades in a row at the worst point
Net: -24.8%
Meanwhile BTC just sitting there did fine. Chart attached.
Now the part that matters.
Breakeven win rate for that payoff is 28.4%. I'm 2.6 points short. And fees plus slippage ate about $1,470 on a $10k account - roughly the entire loss. Before costs the strategy is near zero. So it's not garbage, it's a coin flip that pays for the exchange's lunch.
The reason is turnover. 118 trades a year. A 20-bar channel on 4h candles is 3 days of price. That's not a trend, that's noise with extra steps. The classic version of this strategy uses 20 daily bars. I scaled the timeframe down and forgot to scale the parameters. Rookie mistake, but the engine caught it in minutes instead of my deposit catching it in months.
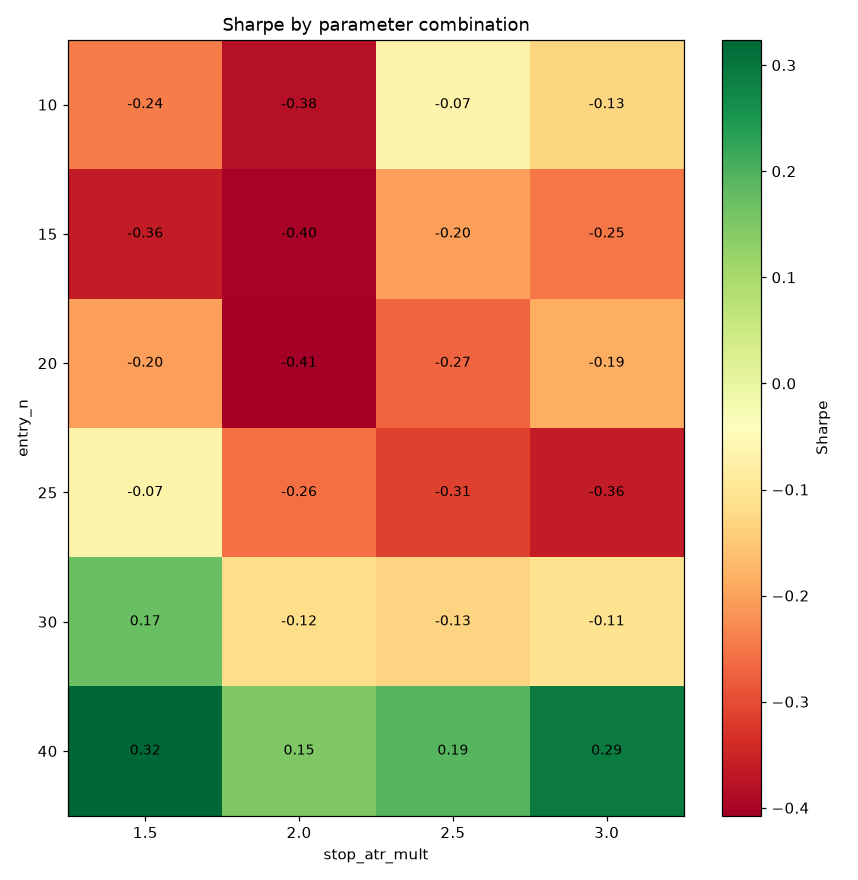
Then I ran a grid over channel length and stop width. Every row from 10 to 25 bars is red. The 40-bar row is green across every stop setting. Not one lucky cell, a whole gradient. That's a hypothesis, not a result - it's still one period, one market regime. But it's the first thing worth chasing.
Next: 6.7 years of Binance data, three separate windows including the 2021 bull, 2022 bear and the 2023 chop, channels from 40 to 160 bars. If the longer channel holds up in all three windows before costs, I have a candidate. If not, Donchian goes in the bin and the next archetype goes in.
Most people build a strategy, see a nice curve and start trading it. I built the thing that tells me the curve is lying.
What was the first backtest that humbled you?
20x leverage. No risk management. No system.
-78.87% in one month. Nov 2025.
At 20x, a ~5% move against you wipes the margin. Every entry came with the same picture in my head: millions I hadn’t made yet.
Sleepless nights. Rage. Gambling that I called trading.
The first thing I wrote in my backtester wasn’t a strategy. It was 3 lines:
1) risk 1% of equity per trade
2) leverage capped at 3x
3) stop at 2 ATR
At 1% risk it takes about 155 losing trades in a row to lose what I lost in a month.
I still want it fast. Everyone does. Position size grows with the account, never faster than it.
@SayLessFX They test different things. Backtest tells you if there’s an edge at all, demo tells you if you can execute it without tilting. My first strategy showed -24.84% after costs over 271 trades. Demo would have needed about 2 years to show me the same.
@0xMortyx Same loop matters even more when the output is a trade. I resampled my strategy’s 271 trades 10,000 times and 9 in 10 outcomes landed between -52% and +26%. A single backtest run is a generate step, not a verify step.
@noisyb0y1 Limits written before the first order is the part most people skip. 87 indicators is also 87 ways to overfit though. My Donchian breakout was -1.75% before costs and -24.84% after fees, slippage and funding, same 2 years of BTC+ETH. Does it score signals after costs or before?
@Bober_smart Same logic should apply to trading agents: a goal, a deadline, and a loss ceiling the agent can't change. I'd add one more rule from the build side: it can propose, but a separate check approves. Did your setup have anything like that between the idea and the launch?
@RohOnChain The useful split I found: let the code compute the indicators and let the model only read the output. If the LLM "runs" an indicator itself, you can't tell a real RSI from a plausible-looking one. Deterministic numbers in, interpretation out, and every call logged.
@Greshamtrade Number 20 is the interesting one for me. Seven bots for a trading desk sounds like a lot of API calls per decision. Has anyone measured whether the extra roles beat a single agent with a strict risk check, once you count cost per accepted trade?
@gippp69 The "AI as a patient tutor" part is the useful bit. I use the same trick for quant topics: tell the model to ask me a check question after every step, not just explain. Passive reading feels like understanding until you try to build something.
Step 7 is where most of these setups die. A forecast that looks sharp on 512 candles usually loses its edge once spread and slippage go in. I'd run Kronos alone against Kronos + the BULL/BEAR debate, same costs. If the agents mostly agree with the model, you pay for extra API calls and get the same signal.
A trader with 17 years of systematic experience ran 6 strategies on daily bars this morning. It took 2.5 minutes and he was done for the day.
Adrian Reed trades the Binance universe with rules that fit an AI trading agent just as well. 8 worth stealing:
the rules:
- trade a portfolio of tokens with each system, then run several systems. one ticker per bot has too little data
- optimize for stability, not the best parameter. a setting of 50 that fails at 40 and 60 goes in the bin. one that works from 20 to 80 gets a look
- shorten the lookbacks. a 200 day breakout is fine in stocks, in BTC he looks at 20 to 50 days
- no in-market stop losses. wicks hit them and price snaps back, so he exits on the daily close
- keep profit targets in the market. one upper wick can fill a target at +250% for a moment
- filter by liquidity. a token must trade millions of dollars a day, or spread and slippage eat the backtest
- keep a hard stop as the failsafe. so many tickers go to zero that "I'll just hold it" is not an option
- stand aside in dead regimes. always-in means sitting through 70 to 90% drawdowns
his claim: triple digit annual returns in backtests with 20 to 40% drawdowns.
One warning from him. The data holds only about 4 bull and bear cycles, so a regime filter tuned on them rests on 4 data points.
Which of these would break your bot first?
@51bodila Buy under -2 z-score sounds clean until you check why the price is down there. A lot of those days are earnings misses or bad news, and price below normal is not the same as price that comes back. Worth counting how many of those entries are just catching a falling knife
@RohOnChain Does it run any out-of-sample check, or does it just rank by in-sample Sharpe? That’s where most auto-generated strategies fall apart for me.
@tsdevstuff yes. time is the only holdout I have left. every bar after Sep 8 is untouched, so I freeze the rules now and score them once on whatever prints.
271 trades. Resample them and 9 out of 10 results land between -52% and +26%.
I resampled my Donchian breakout's trades 10,000 times (BTC+ETH, 4h, fees, slippage and funding included). The median outcome was -24%. The width around it is the actual result.
Before costs this strategy was roughly flat. After fees, slippage and funding: about -24%. 82% of resamples ended below zero.
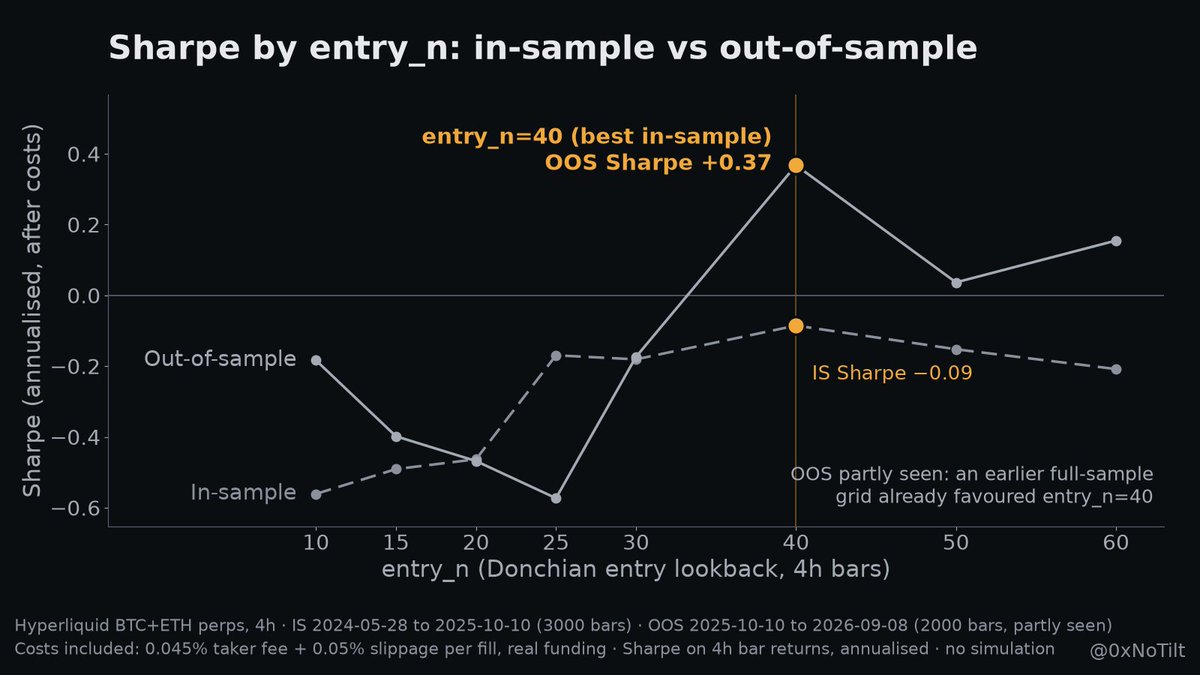
Then the standard check: optimize on the first 60% of the data, test on the rest. The best in-sample setting (entry 40) also won out-of-sample, with and without costs. Looks like success. The details say otherwise.
In-sample, all 8 settings lost money after costs. 40 was just the least negative (Sharpe -0.09). And the out-of-sample period wasn't clean: an earlier full-history grid had already pointed at 40. I peeked, then called it a test.
Ernest Chan said at QuantCon that your backtest is one path out of a distribution. My numbers agree with him, and they say there's no edge here yet.
What's the last "optimal" setting you only ever tested on data you'd already seen?
@Dan1ro0 21 trades an hour for 77 days is about 38,800 trades. $82.8k over that is roughly $2 per trade on a $205 stake, so about 1% a trade.
that has to survive fees and spread every single time. what were the fees per trade?
Call me paranoid, but be extra careful visiting ANY web site in the next few days, as some web admins are not always up-to-date with security patches.
Two vulnerabilities (CVE-2026-109618 and CVE-2026-109619) reported for PHP, the web programming language, affecting servers running popular apps like WordPress and Magento, with patches released October 21, 2026 after details leaked early.
Exploitation was confirmed in the wild soon after disclosure, prompting quick WAF protections and patching by IT teams, as unauthenticated attacks could turn visited sites into vectors for credential theft or device exploits.
Stay SAFU!
@RohOnChain good checklist. one question on step 3: how do you stop the agent from tuning on the "unseen" data after the first backtest?
my first strategy looked fine until costs went in: flat before, about -24% after.
@cz_binance "manage risks" is a slogan until it's a number. mine: 1% risk per trade, 3x leverage cap.
the account I blew had rules too. nothing enforced them.