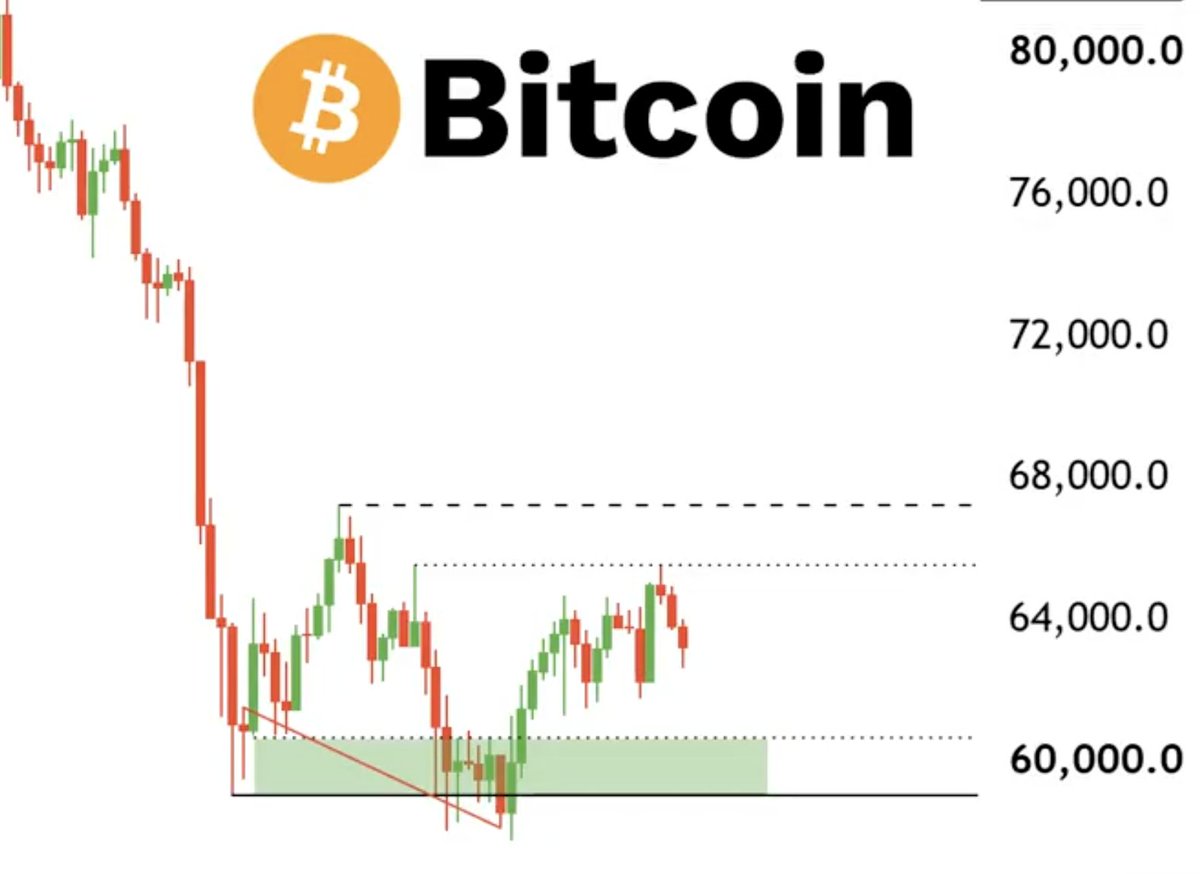
3 things to look for in a trade:
1) A liquidity sweep
2) An Order Block that forms after the sweep
3) A FVG attached to that Order Block
That's a good trade. Might build something just for this.
$BTC
On Feb 12th the BTC fear/greed index plummetted to 5.
That's even lower than the COVID crash, 8 and the 2018 bear market bottom, 11.
Today, we're just stuck in this boring ranging market.
THE BITCOIN CLOCK NEVER LIES AND IT POINTS TO OCTOBER 9
Over a decade of cycles and this rhythm has never once broken:
Bull phase: 1,064 days
Bear phase: 364 days
2015-2017 → 1,064 days up
2017-2018 → 364 days down
2018-2021 → 1,064 days up
2021-2022 → 364 days down
2022-2025 → 1,064 days up
2025-2026 → 364 days down
Run the math on every cycle and the same date emerges October 9, 2026
Not a prediction a pattern that has repeated without a single exception across every cycle $BTC has ever completed
Not surprising.
- Points program for everyone
- Favorable affiliate program
- Airdrop architecture similar to HL
- Fees rivalling to top perp DEXs out there
And now, sufficient liquidity for great spreads.
AFX has already climbed from #17 → #11 on @DefiLlama's Perp Chains leaderboard.
Every week, more traders.
More volume.
More liquidity.
Season 1 was about proving the product.
Season 2 is about scaling it.
👉 https://t.co/ou4vYi9n3r
Heatmaps are useful for general sentiment analyses, but it misses a key factor.
All traders set TP/SL.
Those bright walls you see, they're not actual positions. They more resemble simulations.
Everyone sees the same chart. Obvious liquidity gets hunted. The visible wall is frequently the trap, not the target.
🚨 THIS HEATMAP SHOWS WHERE BTC IS ABOUT TO MOVE
This is one of the most important charts in crypto right now, and almost nobody looks at it!
This is the Bitcoin liquidation heatmap.
Those bright horizontal bands aren't random. Each one is a WALL OF LEVERAGED POSITIONS sitting exactly at that price.
Price doesn't just drift. It moves toward the thickest liquidity.
Right now, there are two massive walls:
→ Around $66,000-67,000 - dense long liquidations stacked from weeks of chop
→ Around $60,500-61,500 - an EVEN THICKER band sitting just below the current price
BTC has been bouncing inside this exact range for TWO WEEKS STRAIGHT.
That's not indecision. That's the market slowly building fuel on both sides.
Here's what usually happens next:
Price grinds sideways until one side gets hunted first.
The lower band is BRIGHTER and DENSER than the upper one.
If that's where liquidity gets taken first, the move down could be SHARP.
Most people are watching the candles!
The real story is the heatmap underneath them.
Follow now so you don't miss the next alpha!
Always consider macro environment.
Things seem to be lining up for crypto.
Can’t say the same for the S&P 500 and its AI bubble.
People think its different this time. They always do.
Prepare for volatility.
🚨 THIS IS INSANE WHAT I JUST FOUND
This is the Dot-Com crash lined up with today's S&P 500.
And the match is almost PERFECT!
Every week, I check if the pattern finally breaks.
It does NOT!
The market keeps following the same structure:
→ Same final pump
→ Same rejection
→ Same first correction
→ Same weak recovery
→ Same setup before the real crash
Now look at the numbers.
Dot-Com crash:
→ S&P 500 dropped around 49%
→ Nasdaq dropped around 78%
→ The collapse lasted more than 2 years
Today:
→ AI stocks dominate the index
→ Valuations are near extreme levels
→ Retail is fully bullish
→ Everyone believes the rally continues
That's EXACTLY how the last bubble ended.
I'm not saying the S&P 500 repeats the Dot-Com crash tick for tick.
But when two market structures track this closely for this long, ignoring it becomes dangerous.
People will say this time is different.
THEY ALWAYS DO!
Follow now - you don't want to miss what's coming next!
Alright I can't keep this a secret any longer.
$BTC RSI is as low as as the 2015 + 2018 bottom and COVID. Draw your own conclusions from that.
Watching 63.7k, the 50D. Weekly close above and 73k comes into play. Lose 58.5k and we wait a little longer.
Yes, most of it was a memecoin. No, I don't think matters.
Liquidity showed up on a chain run by a regulated, publicly company - fast.
The interesting question isn't the volume. It's whether "trusted brand + permissionless rails" beats crypto-native purity over time.
First real test of that at scale.