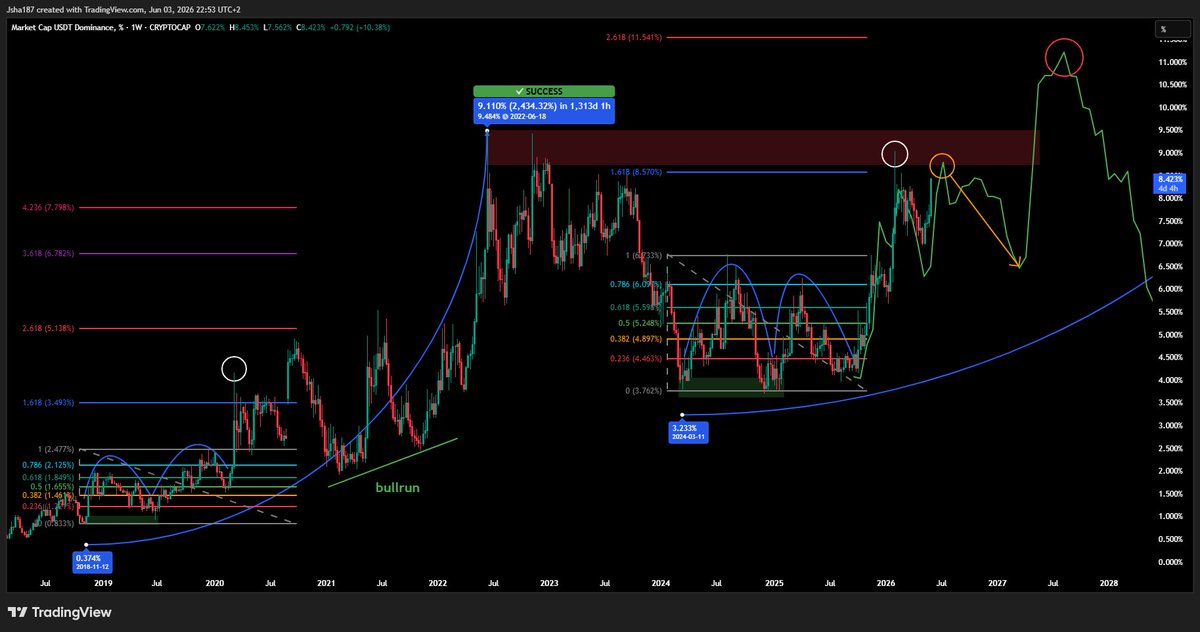
$USDT.D
Local Bottom?
You know the problem with BTC and altcoins?
They're easily influenced by news, narratives, sentiment, and liquidity flows.
That's why I pay so much attention to the dominance charts.
They tend to show the bigger picture.
And right now, many of them are moving remarkably similar to the 2018–2020 accumulation phase.
That's what keeps my attention.
Because if you're reading the cycle correctly through these charts, you've already won half the battle.
The noise becomes irrelevant.
The only thing left is having the patience to let it play out.
Daily / Weekly
$USDT.D
I think the top (gold circle) of this fractal could mark the beginning of the current altcoin rally.
The red circle is likely a retest phase.
Whether it's a retest of a wedge, breakout level, or another structure doesn't really matter.
What matters is that many charts, especially $OTHERSBTC, are showing the same behavior: breakout, retest, and continuation.
That's exactly the type of price action you would expect to see at the beginning of a larger trend reversal.
The start of the BULLRUN.
Brett is taking over Monaco🛑
We’re giving exclusive Saturday terrace access to one F1 content creator with GrandPrixVIP & SportsInTransit
Watch one of Formula 1’s most iconic races from the best seats in the house.
Check out the Instagram post below for more info 👇
https://t.co/3M6UkeAxjC
$BTC
We have seen this before.
At some point, it stops looking like coincidence and starts looking like a repeating market behavior.
The same sentiment shifts.
The same disbelief.
The same calls for lower prices while the market slowly starts building a base.
And then, before most people realize it, price has already moved far enough that they start waiting for a pullback that never comes.
That doesn’t mean history has to repeat exactly candle for candle.
But when multiple charts, multiple timeframes, and multiple market metrics keep pointing toward the same outcome, it becomes harder and harder to ignore.
The longer I watch these structures develop, the more they remind me of previous accumulation phases where patience was rewarded and emotions were punished.
Definitely not coincidence anymore.
solana:5UUH9RTDiSpq6HKS6bp4NdU9PNJpXRXuiw6ShBTBhgH2
"I'll buy lower."
The famous last words of every future exit liquidity provider.
First they wait for a dip.
Then they wait for a bigger dip.
Then they wait for confirmation.
And before they know it, price is 3x higher and they're buying the breakout they swore they wouldn't chase.
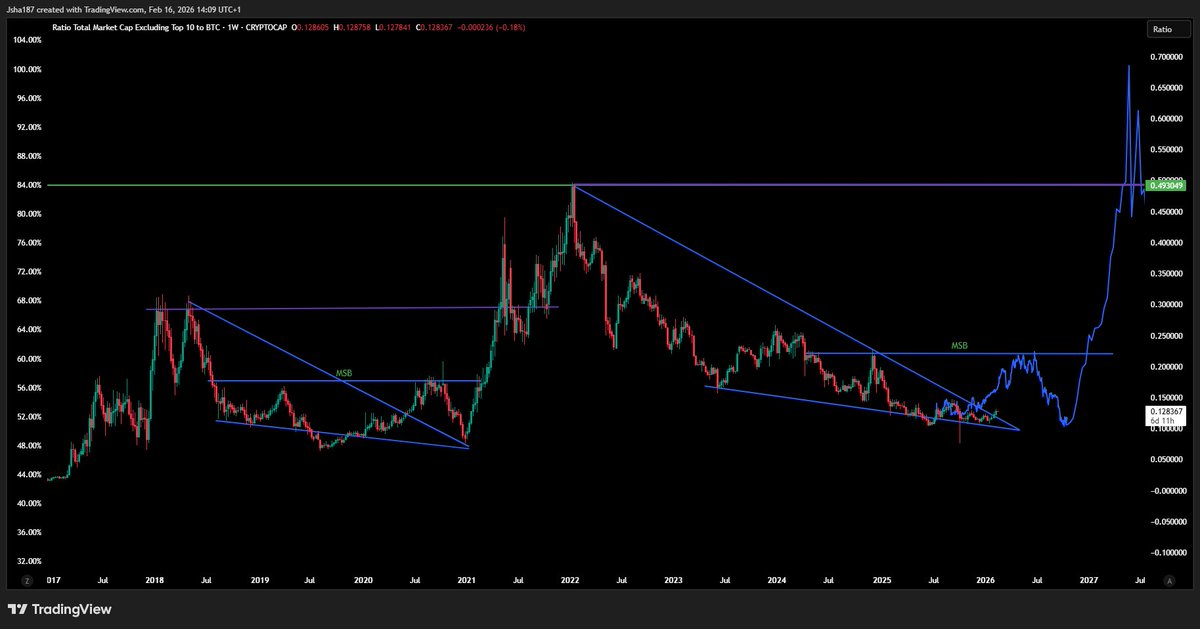
$ALTS / $BTC/ $BTC.D / $TOTAL 3 / $OTHERSBTC
I wrote this months in advance.
And now it's confirmation after confirmation.
The same structures, the same rotation, the same temporary alt strength while BTC slowly grinds higher.
For now, I still see this as a rally within a larger accumulation structure.
But I must say, if this $TOTAL3 fractal continues to play out as expected.
There is also a real possibility that selling too early while waiting for much lower prices could become a mistake.
That's something worth thinking about.
The market rarely gives everyone the perfect re-entry.
I’ll be here to tell you when I think this rally is reaching its top.
Until then, enjoy the ride.
$ALTS
Slowly everything is unfolding, and my thesis is playing out step by step — with some adjustments along the way.
Right now it’s shaping up for a similar altcoin rally like we saw in March–December 2024.
I see a lot of people posting OTHERS charts suggesting that altseason is about to start immediately again.
And that’s exactly why I’m sharing this — to prevent at least one person from bagholding.
I’ve said it many times: we are repeating the 2018–2020 accumulation phase.
The OTHERS/BTC structure continues to confirm that.
For a true altseason to begin, BTC typically needs to go parabolic.
That’s not what I’m expecting.
Instead, I’m expecting a slow and steady BTC grind higher.
That allows alts to rally and catch up temporarily.
After that, BTC.D likely pushes higher again and takes back leadership — creating what many mistake for a full altseason, but is often just a rotation trap.
Only after that phase can we start seriously talking about a broader, sustained altseason — and that could easily take another year.
If you’re in solid profits, take them.
Don’t let anyone convince you that “higher targets” are guaranteed.
$BTC
$BTC.D
$TOTAL 3
$OTHERSBTC
based-brett:native
looking juicy here.
At this point, I don’t even know if I still need to say anything.
The chart, the positioning, the sentiment reset, the growing holder count it’s all right there in front of you.
Just because the price went up doesn’t mean we’re in a bull run.
A real bull market is driven by broad participation, strong volume, retail hype, and sustained momentum.
BTC breaking ATHs alone isn’t enough.
Altcoins need to break ATHs too.
Right now, Bitcoin has pushed into new highs while most of the market is still lagging behind.
So calling this a full bull run is questionable when the majority of altcoins are nowhere near their previous highs.
Otherwise, you could argue that alts are simply dead — along with large parts of the broader market.
This was simply a more institutional cycle within a larger accumilation model
I reckon you follow what I’m saying.
I’ve been covering this for quite a while now, and there’s a thread coming soon.
$TROLL
The market already chose a winner.
People are still aggressively buying these dips.
61,642 holders 22 may.
63,180 holders today.
That kind of growth during uncertain market conditions says a lot.
And don’t forget, TROLL already pulled a 12x from the lows while most of the market is still asleep.
To me, that only suggests this is the warm-up phase.
The strongest memes usually show relative strength before the rest of the market catches on.
Honestly starting to give me early PEPE-type winner vibes.
$BRETT
Man, it’s all about the journey and the process of learning the crypto trenches.
It’s now been exactly 2 year since I first entered BRETT on April 6, 2024.
I rode it all the way up to a 2.3B market cap, and eventually all the way back down again.
But sometimes the real opportunity comes after the hype fades.
Now it is about re-entering at strong risk-reward positions that can eventually make up for the losses.
Don’t mistake the silence for weakness.
BRETT will move again when the time is right.
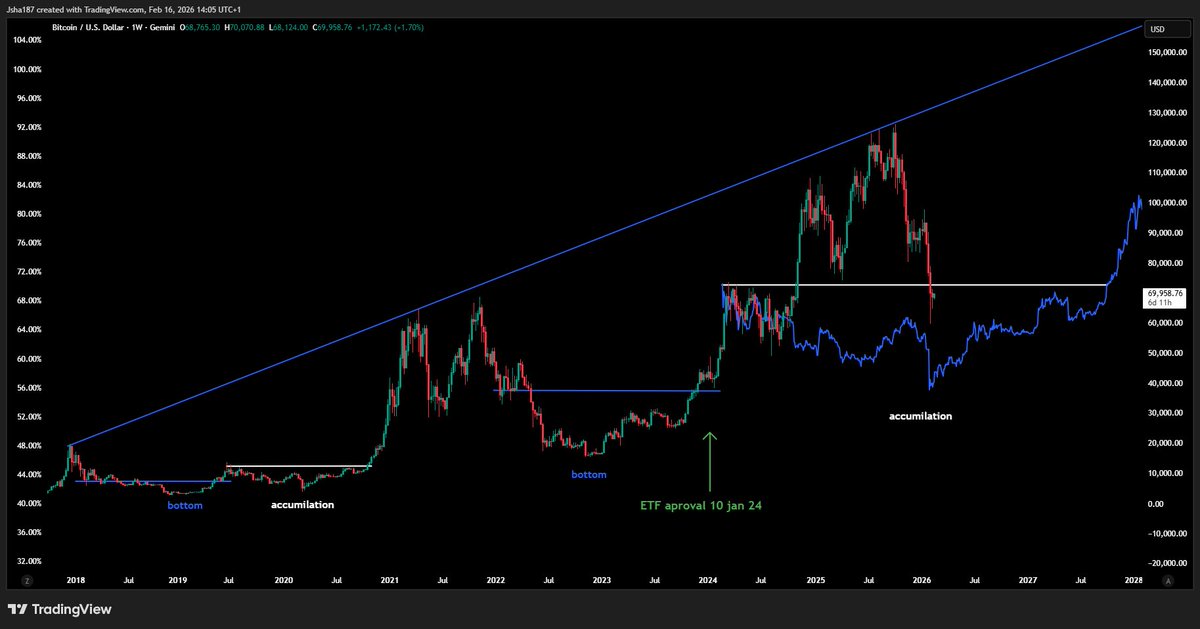
$BTC
Chart looking clean.
Still holding the 2021 highs as support while Q4 is approaching.
At some point, the amount of confluence becomes hard to ignore.
Can’t be coincidence.