📊 Want to dive into data analysis with R? 🤓
Learn how to create tables and descriptive statistics using R programming. Whether you're new to data science or just need to analyze data, we've got you covered 👉 https://t.co/0m32PFXyCL 💡📈
#DataAnalysis#RProgramming
📊 Dive into R programming with Dr. Greg Martin! Learn data cleaning and analysis step-by-step. 🧹 Perfect for data enthusiasts! 💡 #RProgramming#DataAnalysis#Tidyverse#DataScience 🎓
👉 https://t.co/QsQMmiXlqM
📊🚀 Watch this beginner-friendly journey using #RProgramming and the powerful #tidyverse! 📈 Learn to explore and understand your data's intricacies with ease. Let's unravel the secrets of data science and quantitative analysis together! 💡
👉 https://t.co/0Id0hICxfX
📊 Dive into R programming for powerful visualizations! 📈 Ggplot simplifies creating plots and graphs for your data. 📊✨ Perfect for stats, quantitative analysis, and data science enthusiasts! 📊👨💻
#RProgramming#DataVisualization#Ggplot
👉 https://t.co/iVTVc3HdT8
📊 Dive into R Programming: Create, Visualize, Analyze! 📈 Watch now to master ggplot for plots & graphs. 📺👨💻 Ideal for R beginners! 🌟 Step into the realm of statistics with us! 🚀
#RProgramming#DataViz#ggplot#Tidyverse#LearnR
👉 https://t.co/3vsjbtOd7U
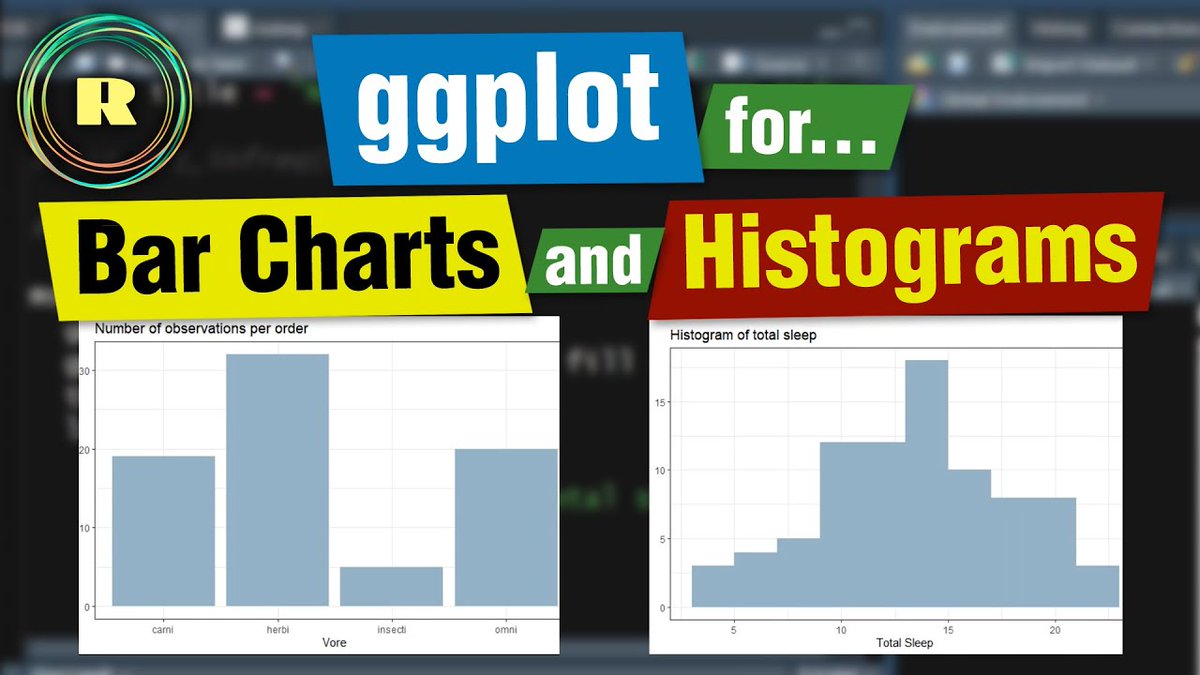
📊💡 Master #DataVisualization with ggplot in R! 📈✨ Create effortless bar charts and histograms. 💪🖥️ If into data science, statistics, and learning R, ggplot2 is a must! 🌟 Join our #RProgramming series to unlock ggplot's potential! 📊👩💻
👉 https://t.co/rmm0PNNotR
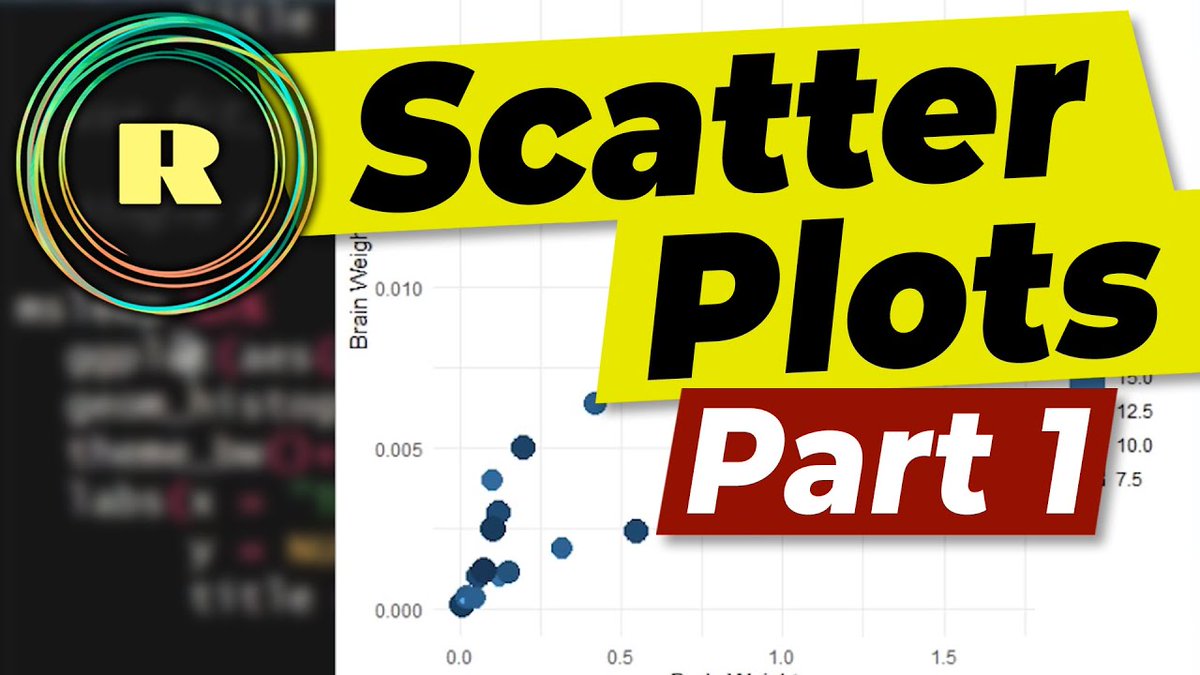
📊🖥️ Discover #DataVisualization in R! 📈✨ Learn easy visualization using R and ggplot. Perfect for creating stunning scatter plots with numeric variables. 🌟 Part of a series for data enthusiasts! 📊📚 📉🧠 #RProgramming#Statistics#LearnR
👉 https://t.co/XKOlsCrbW7
📊💡 Master #DataViz with #ggplot in R! 📈✨
Create captivating plots with #ggplot2 in #RProgamming! 🖥️
Explore numeric & categorical data, crafting engaging scatter plots & insightful linear models. 🎥📈 📊📚
👉 https://t.co/24TftDosU6
Discover the ease of #RProgramming! Learn to use functions with data objects through this video—a fundamental step in mastering R programming. 📊 Making stats simple! 👍
👉 https://t.co/K9cLEzyIXa
📊 Dive into #RProgramming with this beginner-friendly video! Learn 10 ways to filter and subset your data. Perfect for stats enthusiasts, data scientists, & quantitative researchers. Don't miss out! 🎥 #DataFiltering#DataScience#QuantitativeResearch
https://t.co/0S1kkswazE
📊 Dive into R Programming for Beginners! 🖥️✨ Learn how to rename variables and rearrange columns with Tidyverse in R! 🚀💡
#RProgramming#DataScience#Tidyverse#DataAnalysis
👉 https://t.co/UuseiucADg
📊 Discover 5 key data types in #RProgramming: character, factor, integer, continuous, and logical. Learn how to analyze data frames and modify variable types in this "R Programming for Beginners" series! 🎥💡 #DataTypes#Statistics
👉 https://t.co/MWJDjVG1zR
📊 Explore #DataManipulation with tidyverse in R! Join "R Programming for Beginners" to master DPLYR commands for data analysis. 🎥🔍 Level up your R game with R Studio! 💡📈 #RProgramming#DataScience#RStats#LearnR
https://t.co/Zn5xtCdsRF
📹 Learn to kickstart your R project! 🚀 Import data, install key packages like tidyverse, DPLYR, ggplot for advanced data analysis. 📊✨
Join our #RProgramming for Beginners series and dive into the world of data science and stats! 📈💡
👉 https://t.co/CPN99Zn9Q7 🖥️
📈 WHY USE R?
Dive into the world of #R programming!
Discover why it's the go-to choice for data analysis over SPSS, STATA, SAS, and more. Watch me calculate means, medians, plot histograms, and find correlation coefficients in this video. 📊
https://t.co/srJZhrlRU0