Top Tweets for #Ggplot


Mapping rivers just got easier! 🗺️💧
Our new blog displays how to create beautiful and reproducible river maps.
#nhdplusTools #dataRetrieval #ggplot #rstats
🔗: https://t.co/oiocmYsN1c

#30DayMapChallenge Dia 15 - Fuego.
Incendios forestales registrados por la CONAFOR en 2024, mapeados por día del año. México.
(Aprovechando un ratito libre para hacer acto de presencia en el reto de este año).
#rstats #incendios #ggplot
#statstab #455 {plotROC} Generate ROC Curve Charts for Print and Interactive Use
Thoughts: I dislike ROC curves, just check out the way you show uncertainty on them.
#roc #auc #roccurve #specificity #sensitivity #signaldetection #sdt
#ggplot #r
https://t.co/BzWfurTioJ

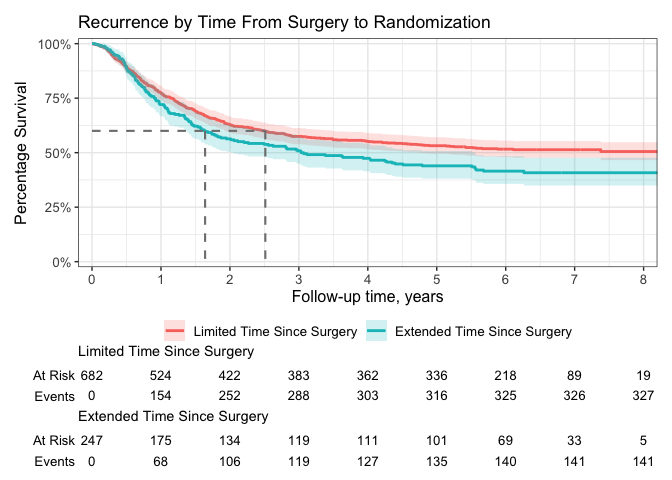
Presenting this data only as the relative ranking of values overestimates the differences between groups! Hope you don't mind, @SteveKornacki - grabbed the data from your post and popped into #ggplot to paint a fuller picture.
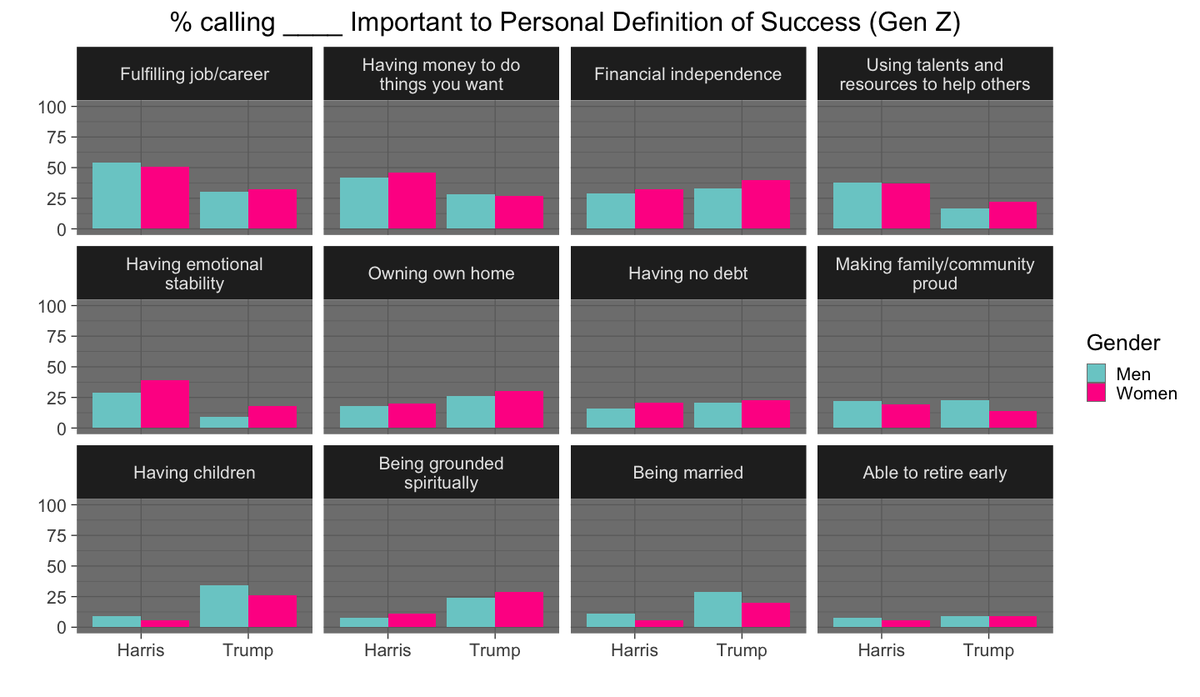

Our NBC News Decision Desk poll asked Gen Z adults (18-29 years old) what they consider important to a successful life. The combination of gender and politics produced two very different sets of priorities:


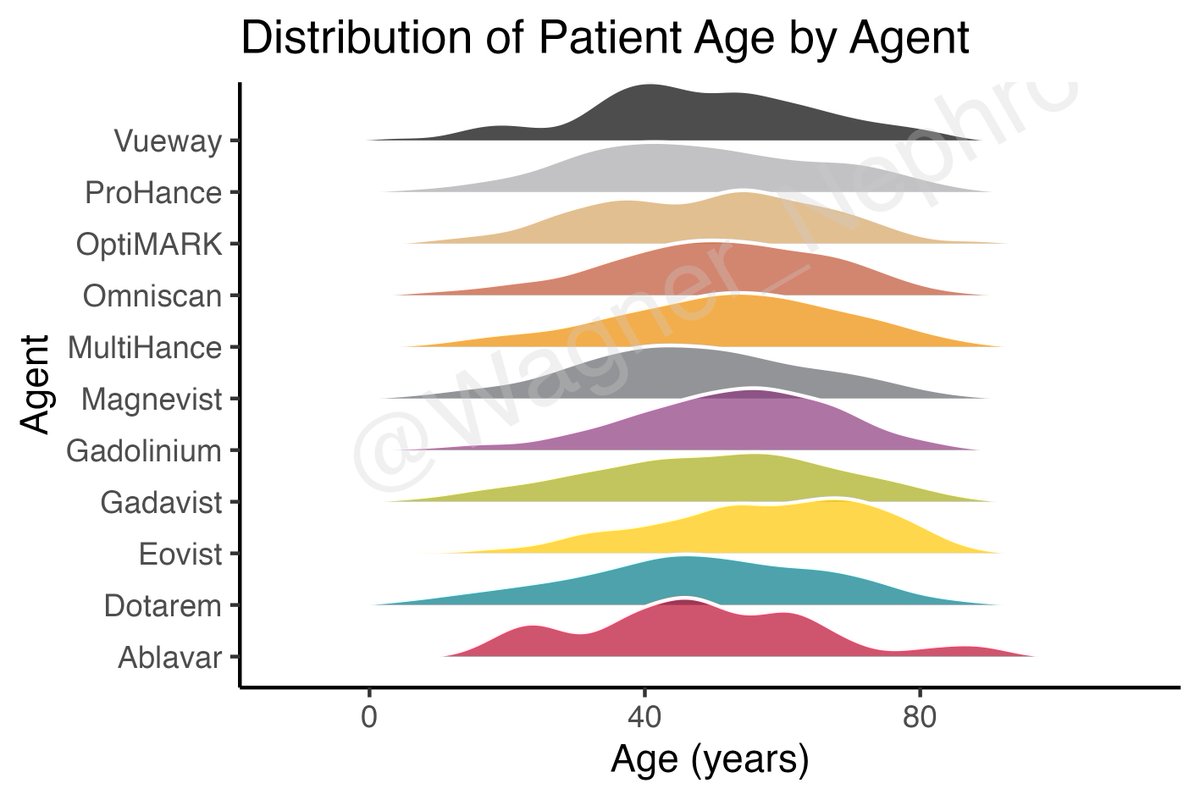
MRI contrast agents and reported adverse events from FAERS (duplicates removed). Age trends visualized with #ggplot ridge plots. #Rstats #pharmacovigilance #FDA

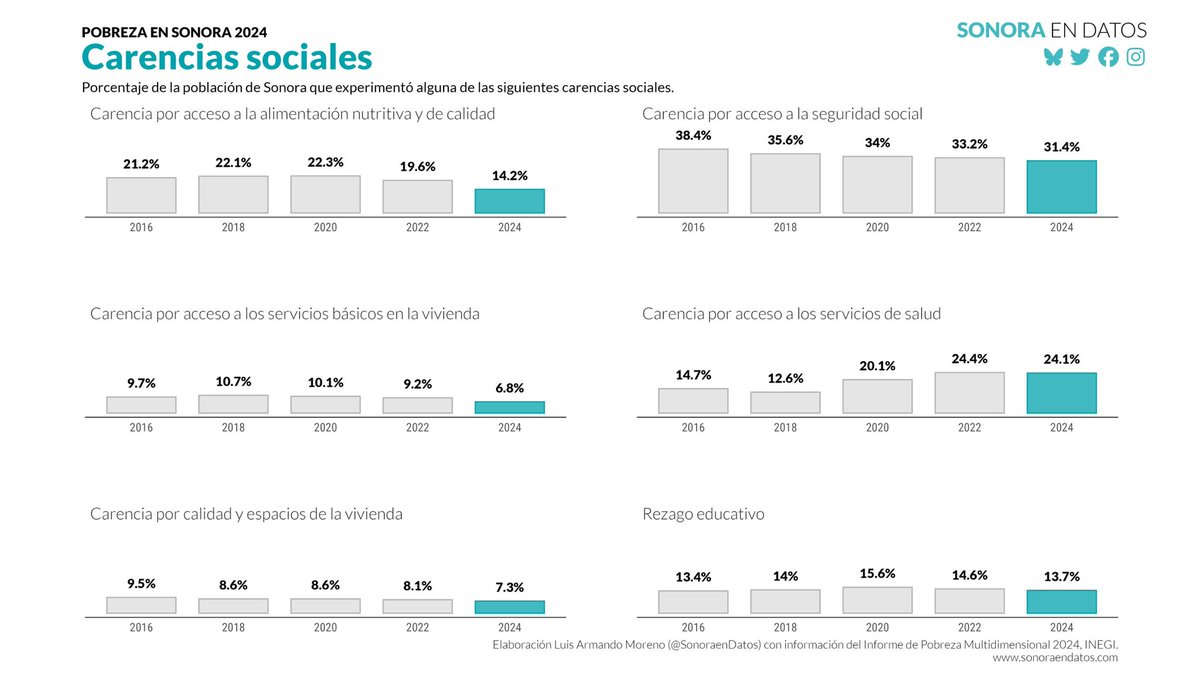
En 2024, 14.1% de los sonorenses carecían de acceso a una alimentación nutritiva y de calidad, 5.4 puntos porcentuales por debajo del registro de 2022 (19.6%).
Resultados de carencias sociales en #Sonora según #Pobreza2024 de @INEGI_INFORMA
#SonoraenDatos #rstats #ggplot


I visualize trends in #ICE #immigration arrests and encounters over time and across select US cities using public data from https://t.co/AVf7ZMY4nF
Here is the #RStats #ggplot code so you can visualize the #dataviz trends in your own city: https://t.co/CUsojCrO21
#codetutorial

I use #ggplot #gganimate #Rstats to visualize spatiotemporal trends in public ICE detention data
Watch ICE detention increase over time: more detainees (bigger dots), more non-criminals (blue → red), and more jails popping up inland in 2025
Code #gist: https://t.co/LN4Jj9F8Ez
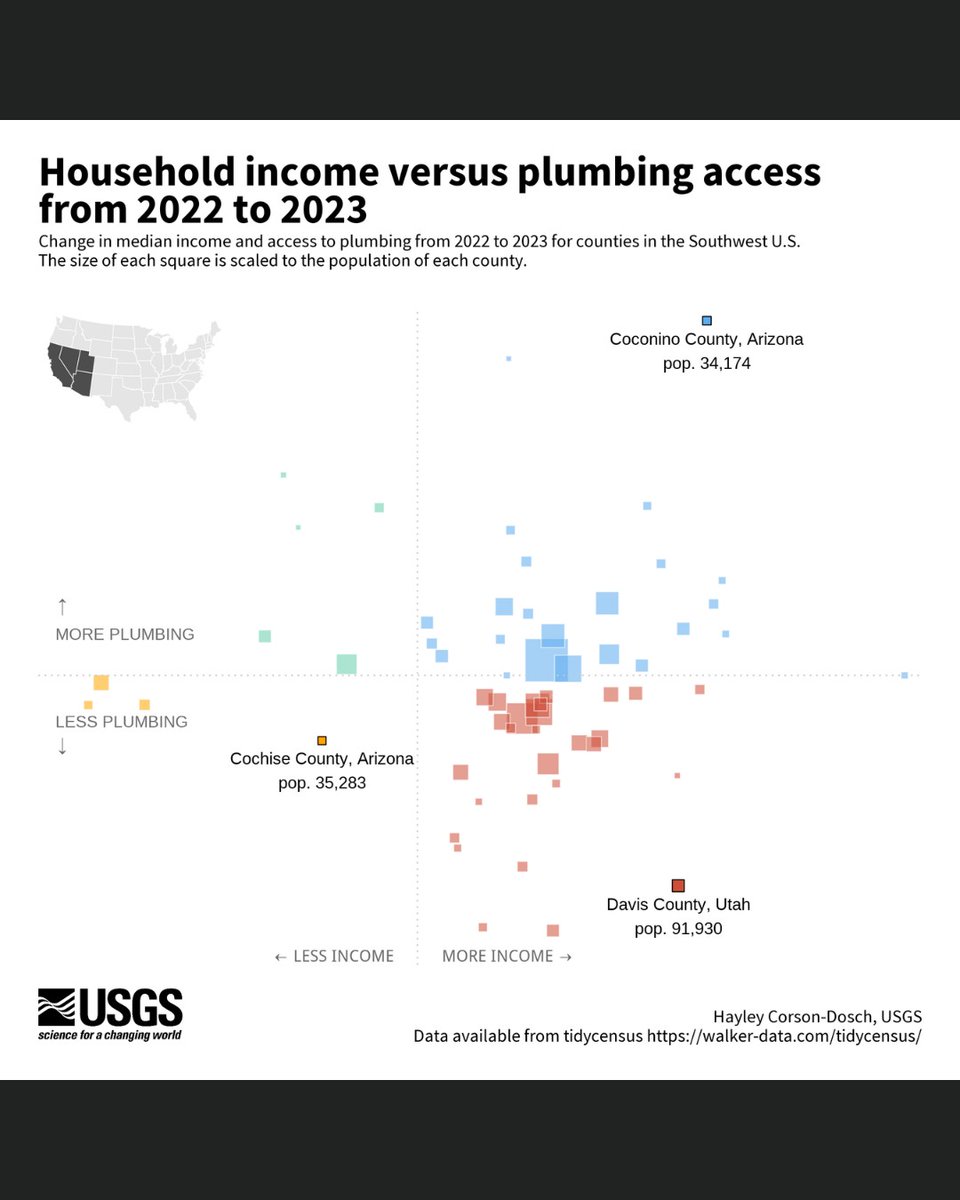
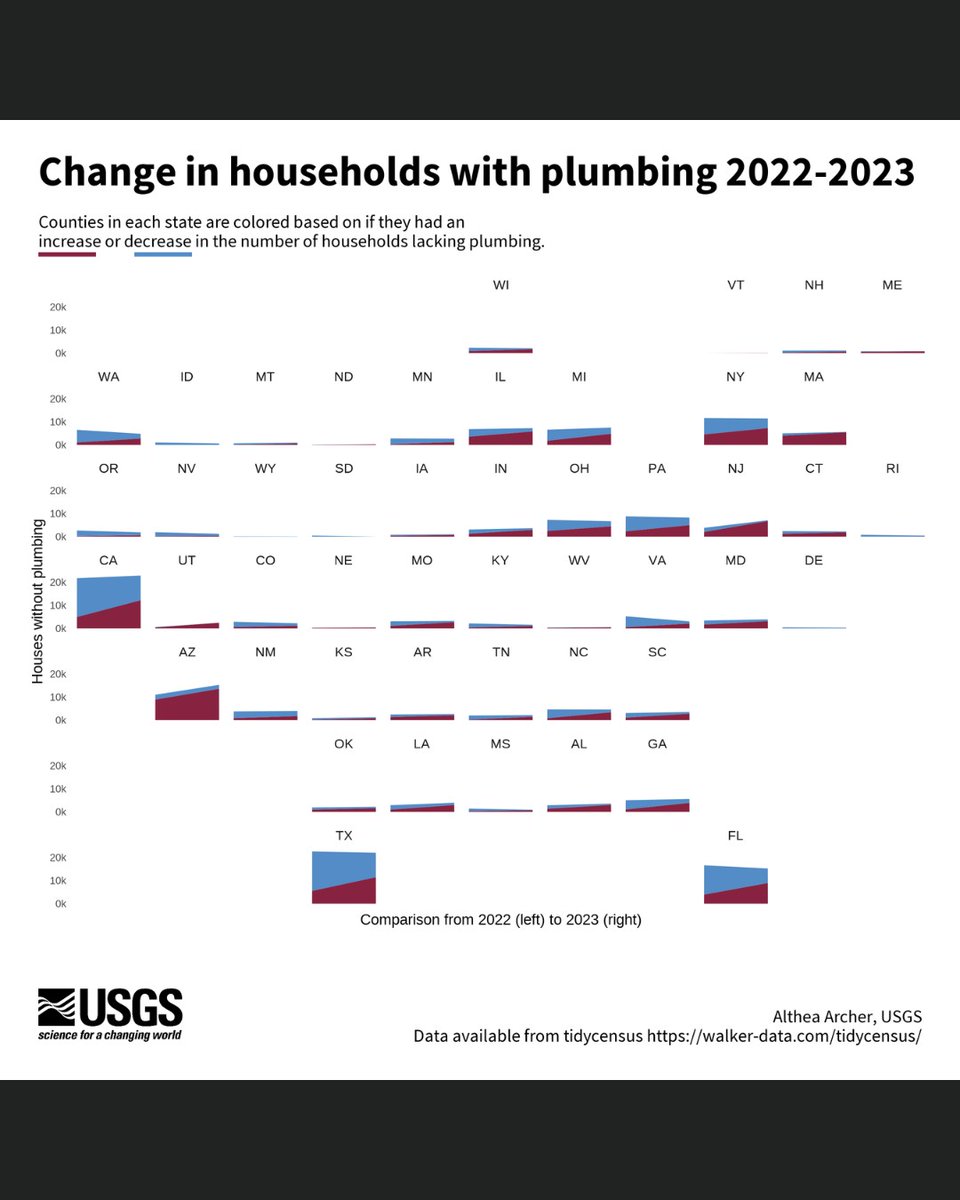
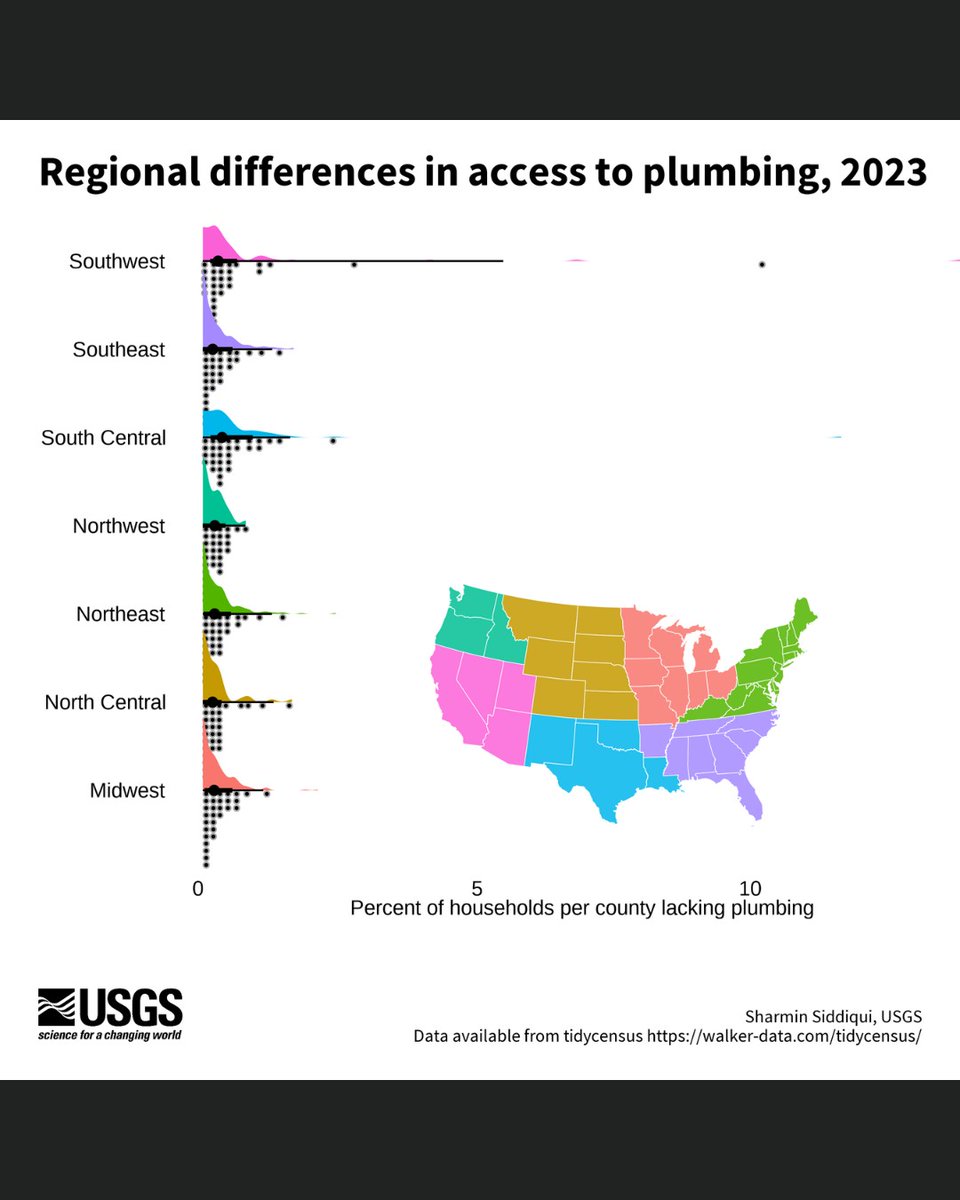
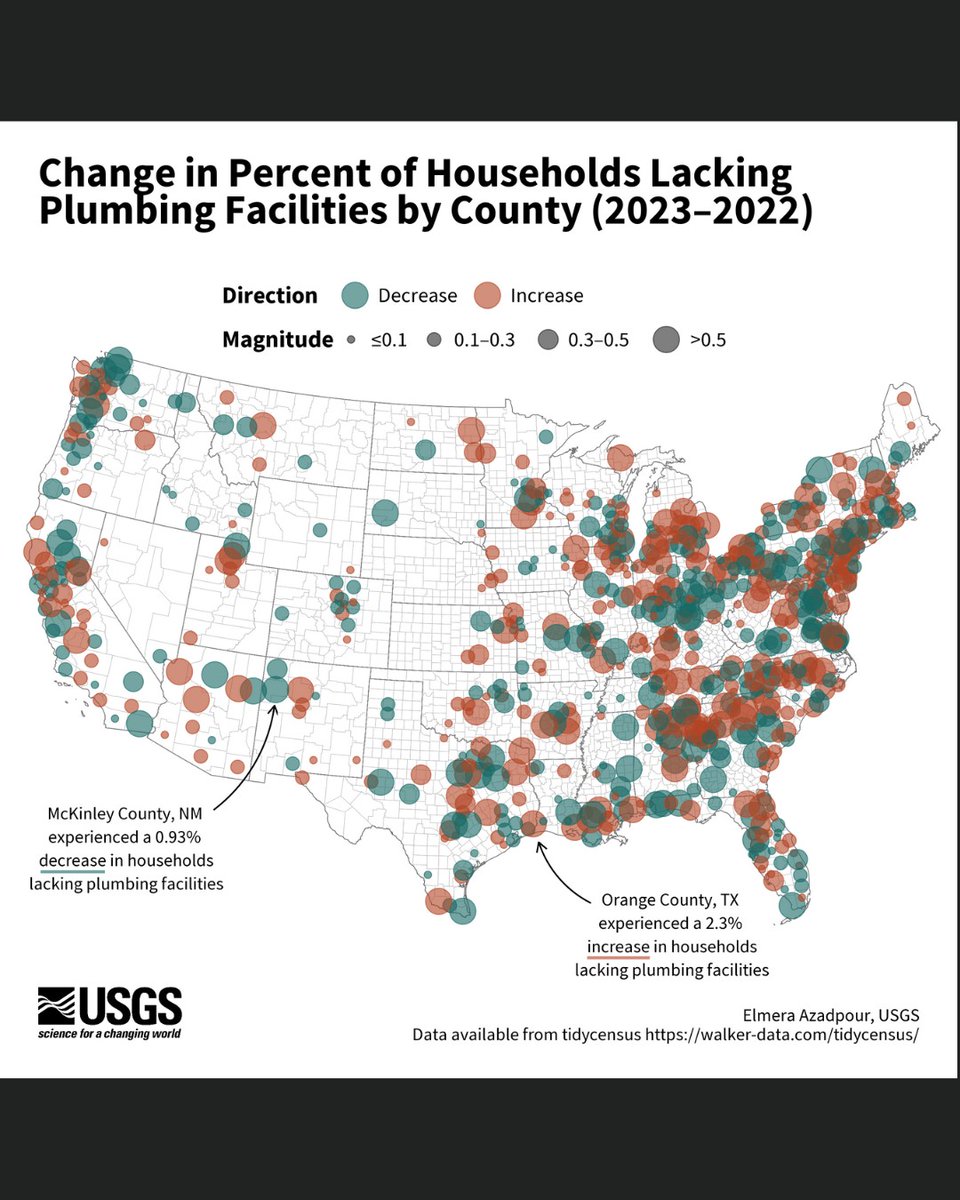
🎉 New blog alert: Charting #tidycensus data with R
Using data from the #USCensus, we created a series of graphs looking at access to plumbing across the U.S. #tidytuesday #reproducible #Rstats #ggplot
https://t.co/nOewHJLsyi
#statstab #350 Communicating causal effect heterogeneity
Thoughts: Cool guide on properly communicating uncertainty in effects.
#bayesian #uncertainty #ggplot #r #brms #tidybayes #heterogeneity
https://t.co/8vBnT8UwBM


Most Popular Users

Elon Musk 
@elonmusk
240.2M followers

Barack Obama
@barackobama
119.3M followers

Donald J. Trump
@realdonaldtrump
111.6M followers

Cristiano Ronaldo
@cristiano
109M followers

Narendra Modi
@narendramodi
107M followers

Rihanna
@rihanna
97.3M followers

NASA
@nasa
92.1M followers

Justin Bieber
@justinbieber
90.6M followers

KATY PERRY
@katyperry
86.8M followers

Taylor Swift
@taylorswift13
80.6M followers

Lady Gaga
@ladygaga
72.2M followers

Kim Kardashian
@kimkardashian
69.4M followers

YouTube
@youtube
68.6M followers

Virat Kohli
@imvkohli
68.6M followers

Bill Gates
@billgates
63.4M followers

The Ellen Show
@theellenshow
62.5M followers

CNN
@cnn
61.9M followers

Neymar Jr
@neymarjr
61.1M followers

X
@x
60.9M followers

Selena Gomez
@selenagomez
59.9M followers