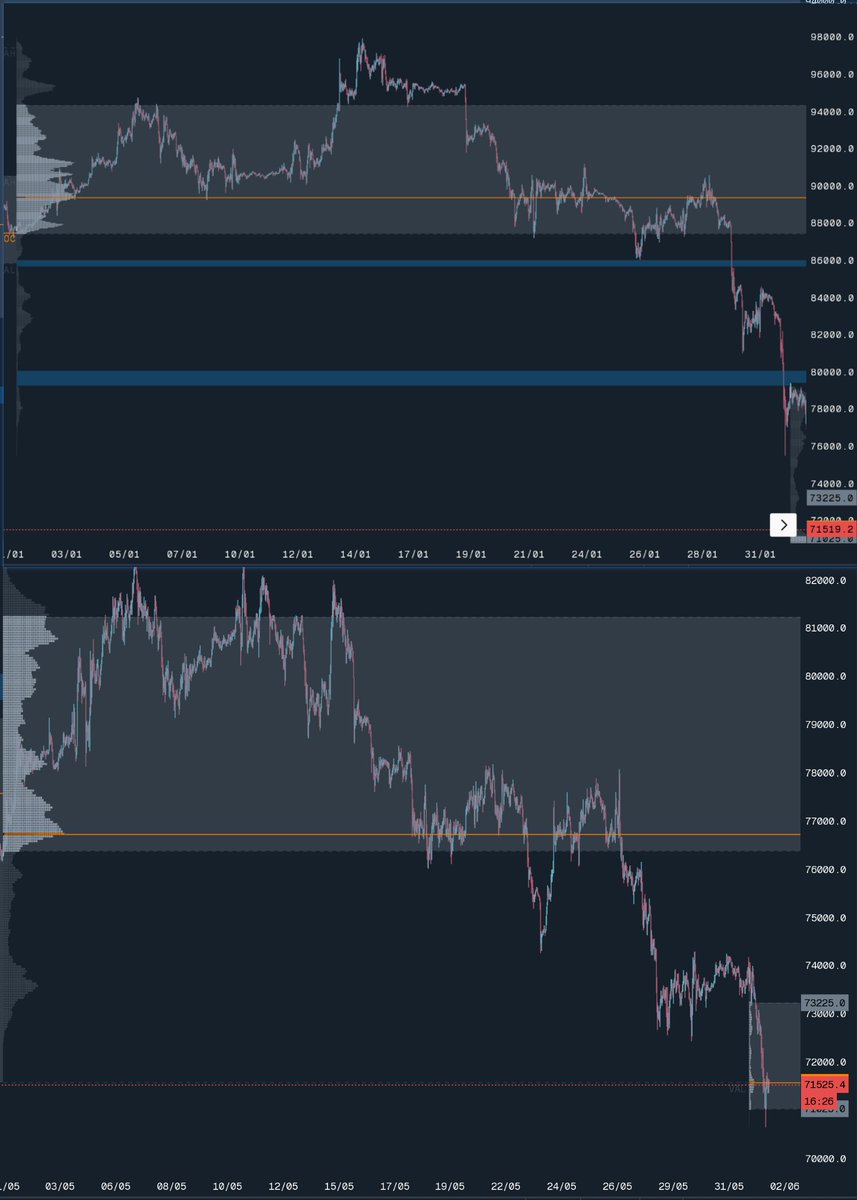
January and May’s monthly TPO structures have several clear similarities:
🔻 First half / first two weeks
Price first moved up clearly in both months and stayed at higher levels. At that time, the VA was positioned higher overall, and the POC was also higher.
🔻 Mid-month
Price started to decline in both months, and both the VA and POC moved down quickly.
🔻 Final week
Both months first broke below the VA and then reclaimed it, but in the final few days, price broke below VAL again and eventually moved outside the value area.
🔻 POC position
In the end, both POCs were close to VAL, showing a very weak structure.
@NecoKronos Binance showed OI↑, CVD↓, delta negative — looks like shorts selling. But NL was rising, suggesting longs were actually stepping in. Interesting indicator.
Yes coach, saw the same.
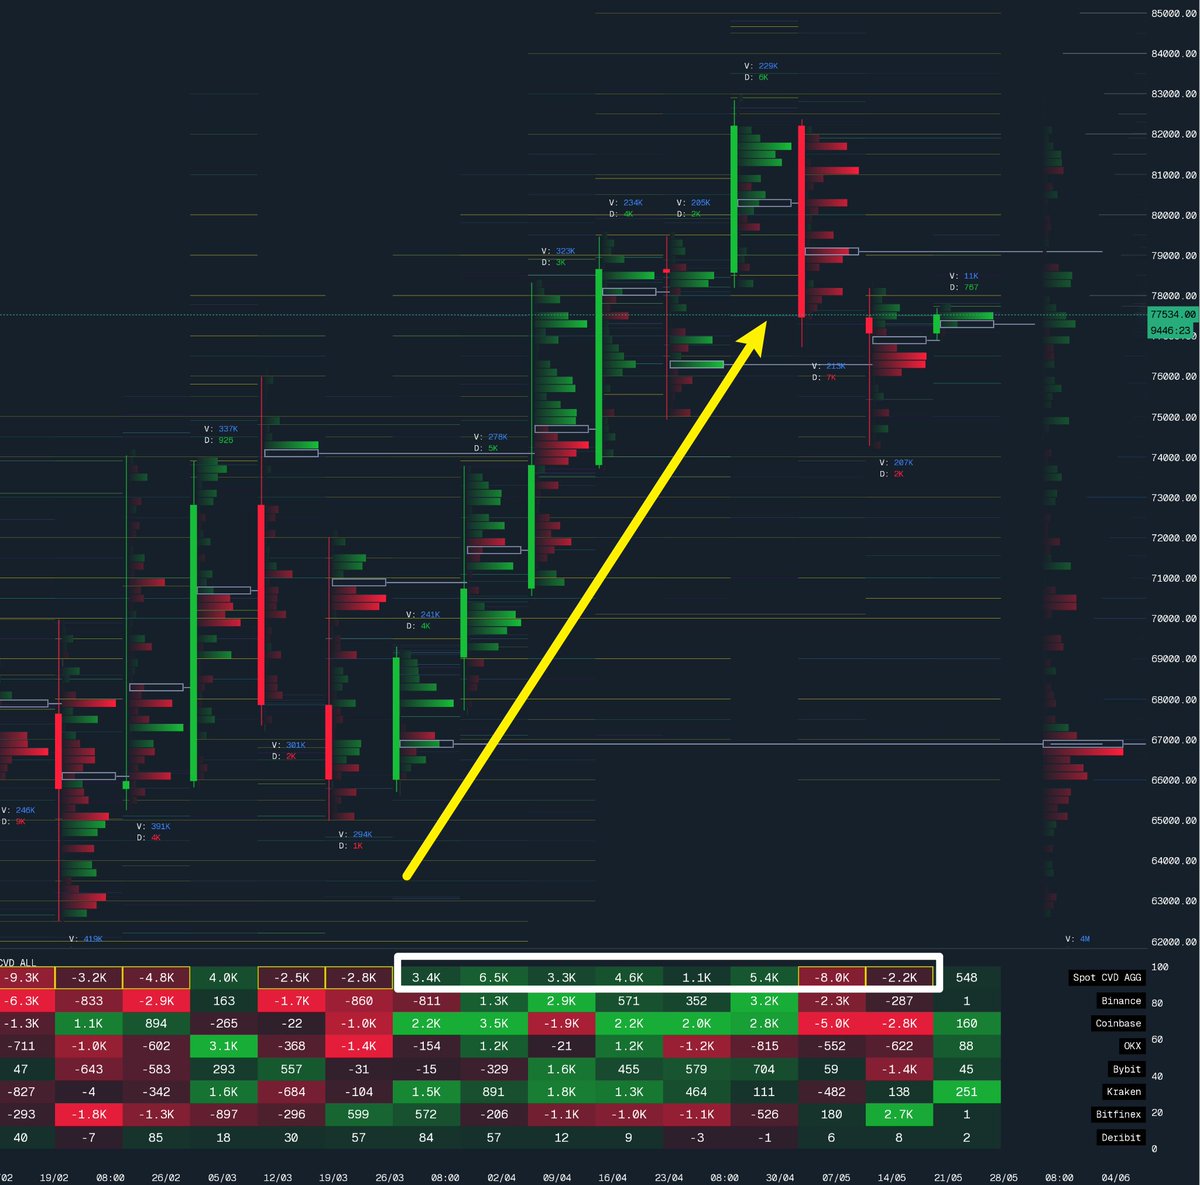
At the low, aggregated data showed OI↑, CVD↓, delta negative — aggressive shorts were selling into bid-side limits and getting absorbed.
From what I saw, a lot of that selling came from Hyperliquid shorts, while Binance NL was rising, suggesting smart longs were stepping in and buying the dip.
Agree, 75.5k–76k looks like a natural liquidation pocket.
I’m also seeing a thick Binance futures bid wall around 75.4k–76.2k, so the key for me is how price reacts there — do those bids absorb and hold, or get pulled/filled and price sweeps lower?
Good area to reassess after the first test.
This looks really cool — kind of like Inception mixed with a liquidity maze.
Smart camera is a great idea, especially for tracking orderbook pressure and liquidity shifts in real time.
My only concern is readability: with so much 3D depth, color, bubbles and vertical bars, is it still easy to read quickly during fast market conditions?
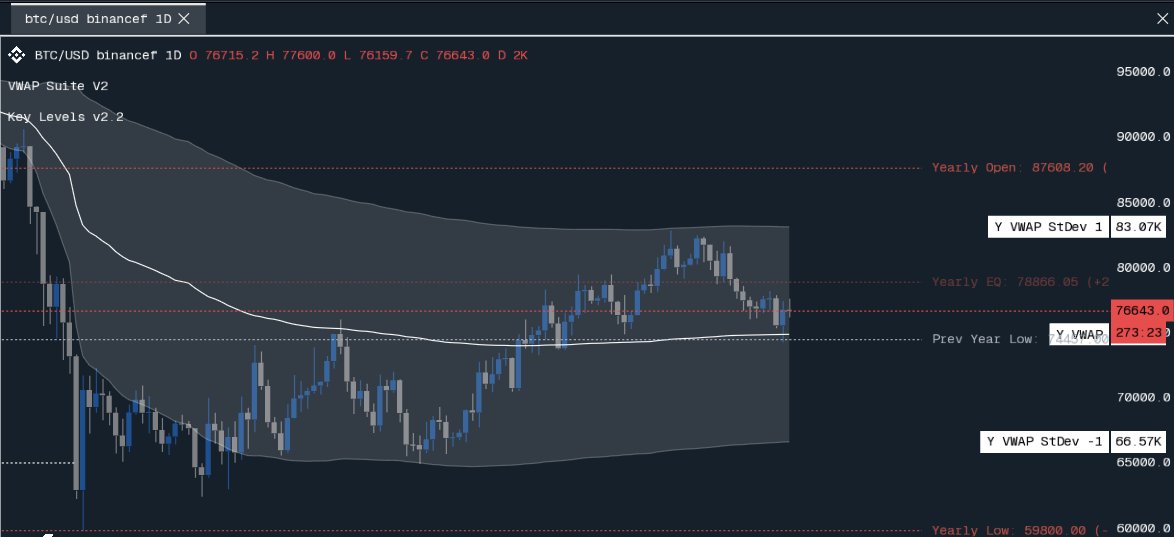
@exitpumpBTC Agreed. I’d also see this as a reaction from the yearly VWAP area, plus it’s around 2025’s low.
So the bounce makes sense. The key is whether BTC can get a daily close above it — that would show real acceptance, not just a quick reaction.
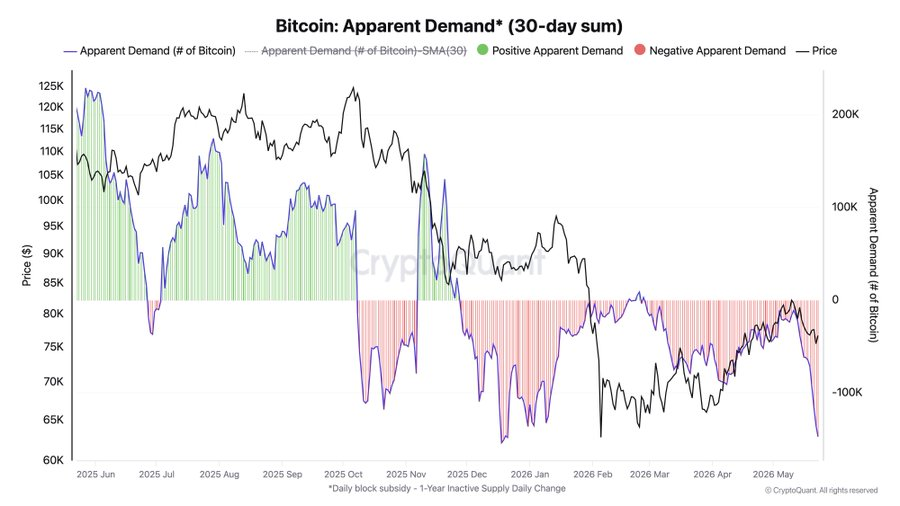
@MMT_Official_ Nice exercise. I’d focus less on the absolute low and more on where the new shorts actually opened.
If shorts opened into the low but failed to get continuation, that low becomes much more interesting. Late shorts trapped + price reclaiming = worth paying attention to.
发现一个相似的结构:
TWAP Trend 从绿转红之后,价格没有直接往下走,而是先反弹了一下,重新靠近上方的 TPO-POC、TWAP 和日内 VWAP 附近。
备注:图里的绿线/红线是 TWAP Trend,黄线是日内 VWAP。
左边那次是反弹到这附近后没站住,后面继续下去了。右边现在也有点类似,但目前还不能直接确认后面就下跌。
另外还有大概 3小时 CME 就开盘了,盘前或者开盘后波动可能会放大,所以这里的反应会比较关键。
-------
Seeing a pretty similar setup here:
After TWAP Trend flipped from green to red, price didn’t just dump straight away. It bounced first and came back close to the TPO POC, TWAP, and intraday VWAP area.
Quick note: the green/red line is TWAP Trend, and the yellow line is intraday VWAP.
On the left, price failed around this area and then continued lower. The current one looks similar so far, but it’s not confirmed yet.
Also, CME opens in around 3 hours, so volatility could pick up into the open or shortly after.
For now, I’d treat this more like a possible bearish retest zone, not a clean sign that bulls are fully back.