In March 1933 the US Mint produced 312,500 of the $10 Indian eagle with the now famous 1933 date. In April, Roosevelt recalled all gold coinage and only a handful 1933 eagles were released. This is one of them and is my moniker.
https://t.co/6XjZgoco61
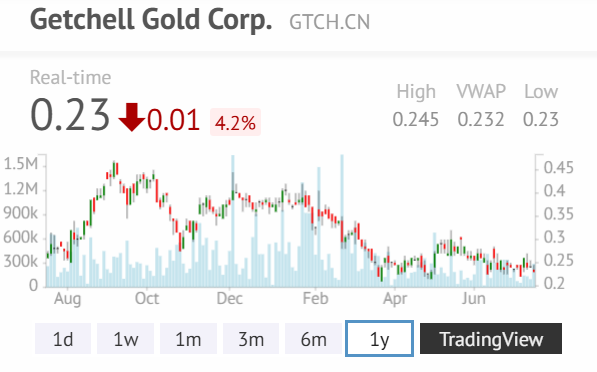
$GTCH.CN - GETCHELL GOLD
I took a position in Getchell Gold.
Nevada Tier 1 Gold, trading at near 3% of the stale 2025 PEA NAV ($474M at $2,250/oz gold vs current $4,000/oz). New PEA is pending, permitting is underway.
The 2026 MRE is proof that Fondaway Canyon is a genuine, scalable deposit — ten holes, 3,346m, 351 Koz of new Indicated added. The Central Area, one square kilometre of a 7km corridor, already hosts 2,811 Koz at 1.29 g/t average grade. MCAP $46M CAD.
At USD$4,000/oz gold and PEA cash costs of USD$1,189/oz, the LOM economics generate USD$3.4B in revenue against USD$1.5B in costs on a USD$226.5M capital investment — an exceptional project.
MCAP/NPV (against the 2025 PEA's own published NPV10%, unscaled, stale $2,250/oz gold assumption): $35.93M / $474M = 0.076x.
MCAP/NAV (rescaled to current $4,000/oz gold and the 2026 MRE, disaggregated for the NV Minerals litigation risk): 0.030x.
Nevada is among the best mining jurisdictions in North America: BLM infrastructure, proximity to existing POX facilities (Barrick Goldstrike ~250km), no social licence risk, no weather impediment to year-round drilling.
Real risk: NV Minerals quiet title suit over 120 of 261 claims. Sized for that. Getchell's BLM and Churchill County records showing active standing since the 1950s are a strong title defence in U.S. mining law, and the MRE published three days after the counterclaim filing, with no resource caveat, signals the QP has reviewed the title situation and is comfortable.
The disaggregated model puts 82.5% combined probability (52.5% full win + 30% modest-cost settlement) on Getchell retaining all or nearly all of the pit-area value.
The Plan of Operations permitting engagement running in parallel with the PEA rather than sequentially reflects a management team that understands the critical path.
Myrmikan's anchor position is not a passive bet — Daniel Oliver runs a concentrated, conviction-driven gold fund with a long-term hard-money thesis, and his USD$1.2M commitment in a CAD$4M raise at a micro-cap explorer is meaningful. Bob Bass remains a disclosed insider holder.
The debt is gone. The 2026 PEA will be the first economic study at anything close to current gold prices; when it publishes, the stock's implied MCAP/NAV at even a mid-development-normal 0.15x multiple would target a materially higher share price than today's — several multiples from here before any premium for deposit scarcity.
DYODD.
$GTCH.CN - GETCHELL GOLD
I took a position in Getchell Gold.
Nevada Tier 1 Gold, trading at near 3% of the stale 2025 PEA NAV ($474M at $2,250/oz gold vs current $4,000/oz). New PEA is pending, permitting is underway.
The 2026 MRE is proof that Fondaway Canyon is a genuine, scalable deposit — ten holes, 3,346m, 351 Koz of new Indicated added. The Central Area, one square kilometre of a 7km corridor, already hosts 2,811 Koz at 1.29 g/t average grade. MCAP $46M CAD.
At USD$4,000/oz gold and PEA cash costs of USD$1,189/oz, the LOM economics generate USD$3.4B in revenue against USD$1.5B in costs on a USD$226.5M capital investment — an exceptional project.
MCAP/NPV (against the 2025 PEA's own published NPV10%, unscaled, stale $2,250/oz gold assumption): $35.93M / $474M = 0.076x.
MCAP/NAV (rescaled to current $4,000/oz gold and the 2026 MRE, disaggregated for the NV Minerals litigation risk): 0.030x.
Nevada is among the best mining jurisdictions in North America: BLM infrastructure, proximity to existing POX facilities (Barrick Goldstrike ~250km), no social licence risk, no weather impediment to year-round drilling.
Real risk: NV Minerals quiet title suit over 120 of 261 claims. Sized for that. Getchell's BLM and Churchill County records showing active standing since the 1950s are a strong title defence in U.S. mining law, and the MRE published three days after the counterclaim filing, with no resource caveat, signals the QP has reviewed the title situation and is comfortable.
The disaggregated model puts 82.5% combined probability (52.5% full win + 30% modest-cost settlement) on Getchell retaining all or nearly all of the pit-area value.
The Plan of Operations permitting engagement running in parallel with the PEA rather than sequentially reflects a management team that understands the critical path.
Myrmikan's anchor position is not a passive bet — Daniel Oliver runs a concentrated, conviction-driven gold fund with a long-term hard-money thesis, and his USD$1.2M commitment in a CAD$4M raise at a micro-cap explorer is meaningful. Bob Bass remains a disclosed insider holder.
The debt is gone. The 2026 PEA will be the first economic study at anything close to current gold prices; when it publishes, the stock's implied MCAP/NAV at even a mid-development-normal 0.15x multiple would target a materially higher share price than today's — several multiples from here before any premium for deposit scarcity.
DYODD.
@Mark_IKN Congrats on the big win yesterday. A fantastic game.
I am really perplexed why Surge has faltered. Please enlighten me as to why the economics fail or the project is deficient. I got out and took a loss so obviously I was wrong but I want to understand why.
@TheDarkLordChap Getchell is supposed to issue an updated PEA next week with more current gold pricing and recent resource per the April 30 news release. Should show a substantial bump in NPV. Stock is sooooo cheap, don’t you think?
@TheApeOfGoldST At 10:30 EST silver dumped $1 on 800 futures contracts of volume and immediately started bouncing back. The algos took most silver stocks lower. These are just not real markets anymore. Very sad to see actually.
@TheApeOfGoldST I know you called out $TUF way back when but that was BEFORE Prairie Creek. You underestimate the value but I do get it. Updated MRE and PEA coming in 3rd quarter and then it will find its true value with hopefully some guidance from the company on its path to production.
Correction: in the previous post, I mistakenly attached the image showing the 25 companies with the lowest drawdowns during the correction, instead of the image showing the 25 companies that actually posted gains during the period.
The key point remains the same, but this distinction is important: the list below highlights the stocks that delivered positive returns while the broader precious metals mining sector was correcting.
@dr_joe11@ben90357282 The PEA and updated resource estimates will be out by end of 3rd quarter. Then we see what they have. Most important is the path to production. How long will it take and how much will it cost? Prairie Creek has millions of dollars of infrastructure already there and paid for.
Many of us share the same positions for certain. My largest positions as of 6/30/26:
$PAAS
$AYA
$HBEIF
$ASM
$GLGDF
$DSVSF
$ABBRF
$USAS
$ANPMF
$CDE
$NEWP
$SCZM
$FNLPF
$AG
$VZLA
Silver ran from roughly 30 dollars to almost 122 in about ten months, then gave most of it back, landing this week near the trendline it climbed the whole way up. The entire silver mania, retraced to the line it started from. And the shortage that drove it did not move an inch.
Look at the two facts side by side. Silver is down about 47 percent from its January record of 121.62, sitting in the high 50s, its lowest in seven months. Over the same stretch, the industrial precious metal entered its sixth straight year of supply deficit, with the Silver Institute putting the 2026 shortfall at 46.3 million ounces, up 15 percent from the year before. The chart round-tripped. The scarcity widened.
That is the part almost no soul is saying. The deficit did not merely survive the crash. It grew during it. Solar makers cut the silver in each panel by nearly a fifth to escape the high prices, and the shortage still widened, because mine supply is falling faster than demand. Price and scarcity did not just diverge. They moved in opposite directions.
So the Silver chart and the balance sheet now disagree at a single line. The chart says a bubble popped. The fundamentals say a shortage is still open, and getting worse. And the two are closer than they look, because at a full retrace to the trendline they draw the identical candle. A bubble that deflated and a bull market resting on support look exactly the same here.
Anyone who tells you with certainty which one this is, up or down, is guessing in a confident voice. Hmm
A metal that solar panels, electric cars, and data centers cannot simply run without is back at the price it began this whole run at, with the deficit that started everything wider than before. The market took back the speculation. It could not take back the scarcity.
@DonDurrett@BrianGoodner Yes it was crazy cheap and still is by most measures. They have a lot of work to do to prove the value but so far they seem intent on being transparent and actually doing the work. Positioned for another Don multi bagger.