An Investment Research Project. Everything from day-trading automated strategies to long only investment portfolios. All asset classes. All geographies.
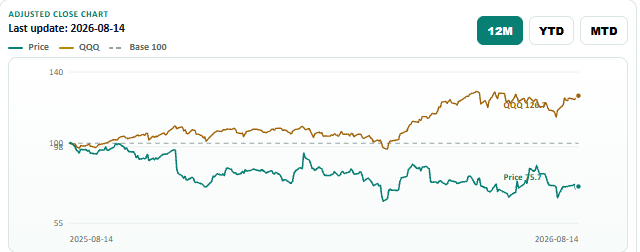
$TEM is improving its fundamentals; the valuation is already rich, and it needs a margin of safety to enter.
Preferred entry is USD 45–50 — below the 200-day at USD 56.97 and near the company`s WACC floor.
Sector Rotation update: The systematic Momentum ETF portfolio has another good month thanks to $Bessent, as it is 30% in $IAU $GDXJ Gold and $SLV $SIL Silver.
My latest market overview and asset allocation letter.
THE CONSUMER IS SLIDING.
July $retail sales fell 0.6% m/m against consensus +0.1% — the weakest in over a year — with the control group −0.4% versus +0.3% expected, and real sales −0.7%. Autos (−2.4%) and non-store (−2.2%, post-Prime Day payback) did the damage; clothing (+1.9%) and bars & restaurants (+0.5%) held up.
The $savings ratio is 2.7% against a ~6% average — the two metrics do not compute well in respect to the booming economy. Most probably, we will get the textbook of K-shape: services and aspirational spend firm, goods and the value end soft. University of Michigan sentiment is declining to 51.0 from 55.2, expected business conditions −11% (short run), −17% (long).
This is a squeeze on $spending power, while wage growth is normalizing towards 2016-2020 average.
$Economists still expect 2–2.5% annualized Q3 GDP on tech capex. Consumption is decelerating toward ~2% - we need to see if the investments in private fixed assets compensate the decline in consumer spending, which is a big portion of the US GDP .
More information and portfolio allocation here: https://t.co/eFSTQ3QyP9
$TLT $IEF Meanwhile, latest US Treasury International Capital (TIC) system data saw a $72bn net liquidation of US Treasuries by foreigners for June. Japan, China and some custodial centres were net sellers, although of note, Canada, Belgium and Switzerland were net buyers.
These are quite volatile data. In the past three months there has been net selling of $56bn by foreigners, while over the past 12 months there has been net buying of $205bn.
$SPY $QQQ Overall net foreign inflows into the US when equities are included remain strong though, at $173bn for June. And at $134bn when banking and short-term flows are included (meaning these saw moderate outflows).
Yardeni: The S&P 500 $SPY is up 141.0% so far this decade, making it the sixth-best decade since the Roaring 1920s. If it rises to 10,000 by the end of the decade, it will be up 209.5%, the fifth-best decade. In other words, roaring decades are not exceptional for the stock market. (The S&P 500 fell during the 1930s and 2000s, and edged up slightly during the 1940s, 1960s, and 2000s.)
To reach 10,000 by the end of the decade requires an additional 28.5% (or 2,201 points) gain in the $SPY S&P 500. That's roughly 7.5%-8.0% annualized price growth over the remaining 3.4 years of the decade.
Two economists mathematically proved that AI will destroy the economy.
Researchers from Wharton and Boston University published a terryfiying paper called "The AI Layoff Trap."
They mapped out the economic end-game of the AI transition, and it exposes a fatal flaw in competitive capitalism.
When a company replaces a worker with AI, it captures 100% of the wage savings.
But that displaced worker is also a consumer. When they lose their job, they stop buying things.
The company gets all the savings, but the loss of consumer demand is spread across the entire economy.
If there are 20 competitors in a market, a CEO only absorbs 1/20th of the economic damage their layoffs just created.
So every single rational CEO has a mathematical incentive to automate as fast as possible.
They can literally see the cliff approaching, and they still step on the gas.
It triggers an unavoidable Prisoner’s Dilemma. If you don't automate, your competitors will, and they will crush you on price.
It doesn't just hurt workers. It destroys the businesses, too.
The economy gets trapped in an automation arms race. Companies fire their workforce to stay competitive, until the entire consumer base is completely hollowed out.
At the limit, the paper concludes: “Firms automate their way to boundless productivity and zero demand.”
And the scariest part?
The researchers mathematically tested every popular fix.
Universal Basic Income? Fails. It raises the living standard but doesn't change the corporate incentive to cut jobs. Retraining? Fails. Worker equity? Fails.
The paper proves that more competition actually makes the collapse happen faster. And "better" AI makes the damage worse.
The only thing that mathematically stops the collapse is a targeted automation tax, forcing companies to pay for the purchasing power they destroy before they automate the job.
$META doubled its revenue in five years. Now comes the bill.
Meta's last six years read like a three-act play: a boom, a near-death scare, and a comeback. We're now in act four, and it's the expensive one.
Act one: the run.
Revenue went from 86bn in FY2020 to 201bn in FY2025. That's more than double in five years, at a scale where doubling isn't supposed to happen. The COVID digital-ad boom did the early lifting (+37% in FY21), then the machine kept going: +16%, +22%, +22%.
Trailing twelve months now sits at 228bn. Still growing — but at +14%, not +22%. That's the first thing worth circling.
Act two: the scar.
FY2022 is the year Meta bulls prefer to skip. Revenue actually fell 1.1%, and operating margin collapsed from 39.7% to 24.8%.
Apple's privacy changes broke ad targeting, headcount had ballooned, and Reality Labs was burning cash faster every quarter.
Then management did something rare: it cut. Hard. Margin went 24.8% → 34.7% → 42.2% by FY2024. Net income went from 23bn to 62bn. That recovery is the single best evidence that this business has real operating leverage when someone chooses to pull it.
Act three: the bill arrives.
Here's the part the headlines undersell. $META Operating margin in the trailing twelve months is 34.8% — down 6.6 points from FY25's 41.4%. That is not a rounding error. Growth is slowing and margins are compressing at the same time.
Why? Because Meta is building.
Capital expenditure went from $37bn in FY24 to $70bn in FY25 — up ~87% — and is running near $89bn annualised. Free cash flow, correctly adjusted, tells the story: $54bn → $46bn → $41bn. The cash engine still runs. It just has a much bigger drain attached.
And the balance sheet has quietly changed character. $META held $51bn of net cash in FY2020. Today it's roughly $2.3bn of net debt, after growing borrowings nearly eightfold to fund the build-out and the buybacks.
So what?
The bull case: this is a company with proven cost discipline spending aggressively into a genuine platform shift, while still generating $41bn of free cash. Amazon's build-out turned its free cash flow negative. Meta's hasn't.
The bear case: you're being asked to fund a capex cycle with no visible revenue line attached to it yet, at the exact moment ad growth decelerates from 22% to 14%. Reality Labs already taught this lesson once.
What to watch: whether the margin stabilises near 35% or keeps sliding, and whether CapEx growth flattens. Those two numbers will settle the argument.
Exceptional business. Expensive transition. Both things are true right now.
Marketroller Club · TVME Protocol. This is analysis, not investment advice — do your own work. Check our substak to ask for the full report.
https://t.co/4nnKptRd8O