✅All it takes is 1 hour a day.
> Shut your phone.
> Close Instagram.
> Close X.
> Close YouTube.
> Sit down for 1 hour.
> Open TradingView.
> Watch charts.
> Study price action.
> Build your pattern recognition.
This is called deliberate practice.
Do it every day for 6 months.
> Most people consume content.
> Very few build skill.
> Your future P&L is decided by what you do when the market is closed.
> You don't need 10 hours a day.
All it takes is 1 focused hour.
Try it for 6 months.
Thank me later. 📈🤗
Hearing wonderful things about #Lenin. Delighted by the unanimous appreciation, especially for @AkhilAkkineni8’s performance. Akhil is very dear to me, like another son and it’s a joy to see him grow with every film.
Congratulations to my dear friend @iamnagarjuna, the entire cast and crew. Looking forward to watching Lenin soon. Wishing the film continued success 💐💐💐
Most people enter the stock market to make quick money.
Professionals enter the stock market to build a lifetime skill.
One mindset loses money.
The other creates wealth.
Aim high. 📈
ಯಾಕೆ ಷೇರಿನ ಚಾರ್ಟ್ ಗಳನ್ನು ಓದಬೇಕು??
✅ಷೇರು ಮಾರುಕಟ್ಟೆ Price and Volume ಮೂಲಕ ದಿನನಿತ್ಯ ನಡೆಯುವ ಚಟುವಟಿಕೆಯನ್ನು ತೋರಿಸುತ್ತದೆ.
ಚಾರ್ಟ್ ಗಳ ಮೂಲಕ ನಾವು ಖರೀದಿ ಮತ್ತು ಮಾರಾಟ ಹೇಗೆ ನಡೆಯುತ್ತದೆ ಅನ್ನುವುದನ್ನು ತಿಳಿದುಕೊಳ್ಳಬಹುದು.
Charts show real time Buying and Selling activities.
✅ಒಂದು ಷೇರಿನ ಬೆಲೆ ಏರಿಕೆ ಇಳಿಕೆ ಹೇಗೆ ಕಾಣುತ್ತೆ ಅನ್ನೋದರ ಬಗ್ಗೆ ಮುಂಚಿತವಾಗಿ ಚಾರ್ಟ್ ಮೂಲಕ ಗೊತ್ತಾಗುತ್ತೆ.
- ಮುಖ್ಯವಾದ Moving Averages (20,50,200 Moving Averages) break ಮಾಡುವ ಮೂಲಕ ಆರಂಭಿಕ ಸೂಚನೆ ಕೊಡುತ್ತೆ.
ಯಾವುದೇ ಷೇರಿನ ಬೆಲೆಯಲ್ಲಿ ಭಾರಿ ಪ್ರಮಾಣದ ಇಳಿಕೆ ಆಗುವ ಅಪಾಯವನ್ನು ಮೊದಲೇ ತೋರಿಸುತ್ತೆ.
Patterns Repeat 🔁 -
ಮೂಲಭೂತವಾಗಿ ಮನುಷ್ಯನ ಆಸೆ,ದುರಾಸೆ,ಭಯ,ವರ್ತನೆ(Fear, Greed, Crowd Behaviour) ಇವೆಲ್ಲ ಚಾರ್ಟ್ ಗಳ ಮೂಲಕ ವ್ಯಕ್ತವಾಗುತ್ತದೆ.
ಇದು ನೂರಾರು ವರ್ಷಗಳಿಂದ ಇದರಲ್ಲಿ ಯಾವುದೇ ಬದಲಾವಣೆ ಆಗಿಲ್ಲ.
ಆದ ಕಾರಣ ಚಾರ್ಟ್ ಪ್ಯಾಟರ್ನ್ಸ್ Repeat 🔁 ಆಗುತ್ತೆ.
ವರ್ಷದಿಂದ ವರ್ಷಕ್ಕೆ,ದಶಕದಿಂದ ದಶಕಕ್ಕೆ ಇವೆಲ್ಲ ಸಾಮಾನ್ಯವಾಗಿ Repeat ಆಗುತ್ತವೆ.
✅ಟ್ರೆಂಡ್ ಗುರುತಿಸುವಿಕೆ (Trend Identification)
"Trend is your friend" ಎಂಬ ಮಾತಿದೆ. ಚಾರ್ಟ್ಗಳು ಮಾರುಕಟ್ಟೆಯ ದಿಕ್ಕನ್ನು ಸ್ಪಷ್ಟಪಡಿಸುತ್ತವೆ.
Uptrend- ಬೆಲೆಗಳು ಸತತವಾಗಿ ಏರುತ್ತಿರುವುದು (Higher Highs and Higher Lows).
Downtrend- ಬೆಲೆಗಳು ಸತತವಾಗಿ ಇಳಿಯುತ್ತಿರುವುದು (Lower Highs and Lower Lows).
Sideways - ಷೇರುಗಳು ಒಂದು particular range ಅಲ್ಲಿ ಇರುವುದನ್ನು ಗುರುತಿಸಬಹುದು. ಇದನ್ನು ತಿಳಿದರೆ ಅನಗತ್ಯ ಟ್ರೇಡಿಂಗ್ ತಪ್ಪಿಸಬಹುದು.
✅ಸ್ಮಾರ್ಟ್ ಮನಿ ಟ್ರ್ಯಾಕಿಂಗ್ (Tracking Smart Money)
ದೊಡ್ಡ ದೊಡ್ಡ ಸಂಸ್ಥೆಗಳು (Institutional Investors) ಅಥವಾ ವಿದೇಶಿ ಹೂಡಿಕೆದಾರರು ಯಾವಾಗ ಷೇರನ್ನು ಖರೀದಿಸುತ್ತಿದ್ದಾರೆ ಅಥವಾ ಮಾರುತ್ತಿದ್ದಾರೆ ಎಂಬುದು Volume ಮತ್ತು Price Action ಮೂಲಕ ಚಾರ್ಟ್ನಲ್ಲಿ ಎದ್ದು ಕಾಣುತ್ತದೆ. ಅವರು ಬಿಟ್ಟು ಹೋಗುವ ಈ "Footprints" ಅನ್ನು ಅನುಸರಿಸಲು ಚಾರ್ಟ್ ಅತ್ಯಗತ್ಯ.
✅ ಸಮಯದ ಉಳಿತಾಯ (Time Efficiency)
ಸಾವಿರಾರು ಕಂಪನಿಗಳ ಬ್ಯಾಲೆನ್ಸ್ ಶೀಟ್ ಓದುವುದು ಕಷ್ಟ. ಆದರೆ ಚಾರ್ಟ್ಗಳನ್ನು ಸ್ಕ್ಯಾನ್ ಮಾಡುವ ಮೂಲಕ ಕೆಲವೇ ನಿಮಿಷಗಳಲ್ಲಿ ಯಾವ ಷೇರುಗಳಲ್ಲಿ ಚಲನವಲನ (Momentum) ಇದೆ ಎಂದು ಪತ್ತೆಹಚ್ಚಬಹುದು.
✅ಭಾವನೆಗಳ ನಿಯಂತ್ರಣ (Emotional Discipline)
ಮಾರುಕಟ್ಟೆಯಲ್ಲಿ ಸುದ್ದಿಗಳು ಅಥವಾ ವದಂತಿಗಳು ಹರಡಿದಾಗ ಭಯ ಅಥವಾ ಉತ್ಸಾಹಕ್ಕೆ ಒಳಗಾಗುವುದು ಸಹಜ. ಆದರೆ ಚಾರ್ಟ್ ನೋಡಿದಾಗ ಅಲ್ಲಿ ಕೇವಲ Fact (ವಾಸ್ತವ) ಕಾಣಿಸುತ್ತದೆ. ಇದು ನಿಮ್ಮ ಟ್ರೇಡಿಂಗ್ ನಿರ್ಧಾರಗಳಲ್ಲಿ ಶಿಸ್ತು ಮೂಡಿಸುತ್ತದೆ.
✅ಚಾರ್ಟ್ ಎನ್ನುವುದು ಷೇರು ಮಾರುಕಟ್ಟೆಯಲ್ಲಿ ಭಾಗವಹಿಸುವ ಲಕ್ಷಾಂತರ ಜನರ ಸಾಮೂಹಿಕ ಮಾನಸಿಕ ಸ್ಥಿತಿಯ ಪ್ರತಿಬಿಂಬ.
Like, Share, Retweet ❤️ 💚
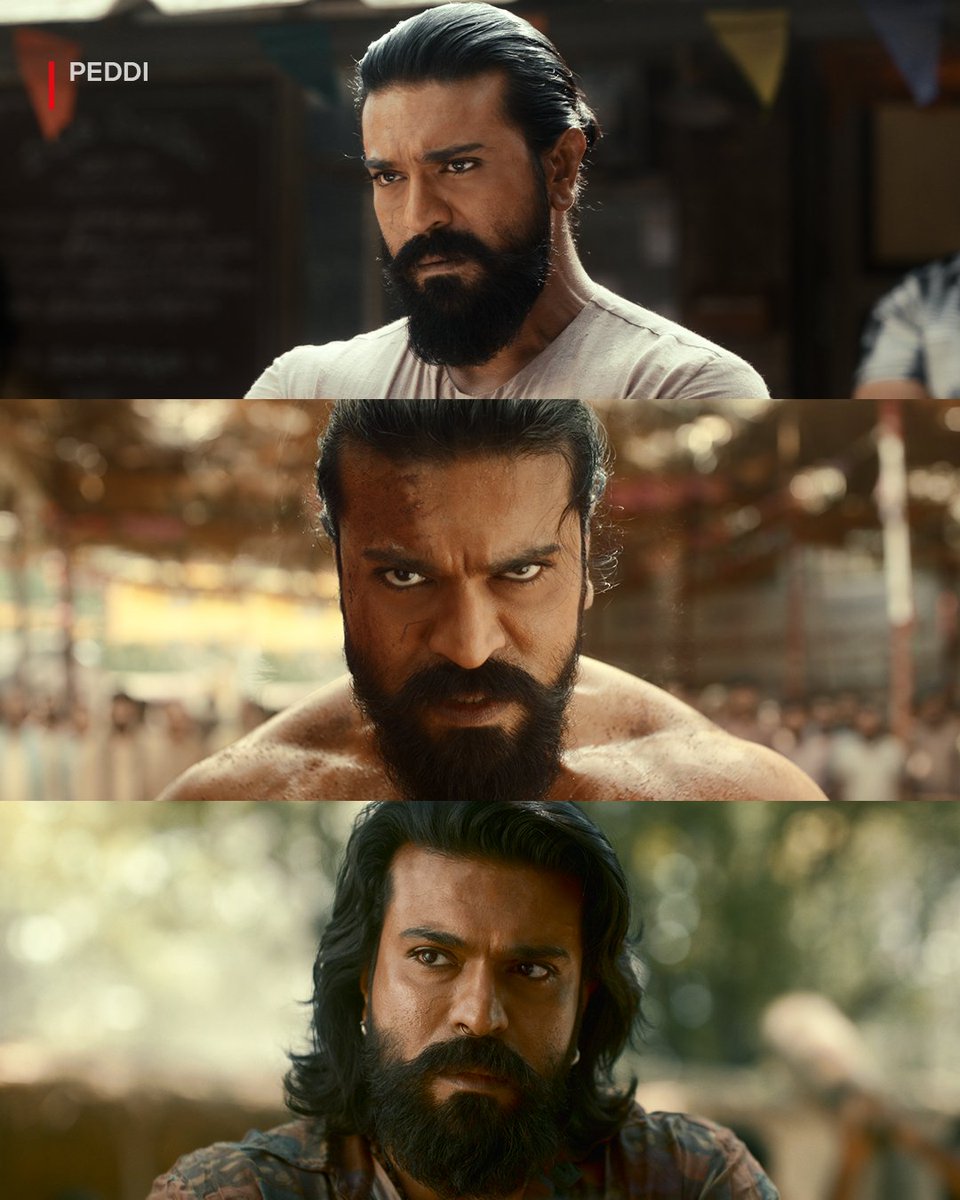
After Ruling Boxoffice & Emerging as 2026's Highest Grosser of South India, #PEDDI Enters @netflix Arena to Win more Hearts ❤️🔥
#PeddiOnNetflix Streaming now.