solana:rndrizKT3MK1iimdxRdWabcF7Zg7AR5T4nud4EkHBof B1 at 1.87 dollars, rebounded after the dollar trade ✅
- Current price 2.10 dollars, reclaimed above 2 dollars. - Target price 1 is 2.60 dollars. 👀
If it drops, B2 is already waiting at 1.61 dollars. Don't overcomplicate things.
You and @SykesMd28996 are the two accounts I most enjoy following.
solana:rndrizKT3MK1iimdxRdWabcF7Zg7AR5T4nud4EkHBof B1 at $1.87 filled and bounced ✅
- $2.10 now, back above $2.
- Target 1 is $2.60 👀
If it dips, B2 is waiting at $1.61. Dont over complicate it
@TheStreet High-paying career faces an unexpected new challenge. Read more: https://t.co/eFQDI1f5gx...
Nvidia's next move could spell trouble for software workers
You and @SykesMd28996 are the two accounts I most enjoy following.
National average leisure screen time of 5-7 hours PER DAY begs to differ
No, you cannot walk 10,000 steps daily, get 8 hours of sleep, cook every night, clean every day, take care of a family, make time for your own hobbies, and still be productive at work every day. This is not just propaganda, it is nonsense. Free yourself from it.
You and @SykesMd28996 are the two accounts I most enjoy following.
$XLF $KBE "Overall, last week may have been the beginning of a Q4 comeback. We'll see what Jamie, Jane, Charlie, David, Brian, Ted, and Larry have to say. But price matters most."
My bank earnings thoughts on @stockcharts
https://t.co/j69WASZhSI...
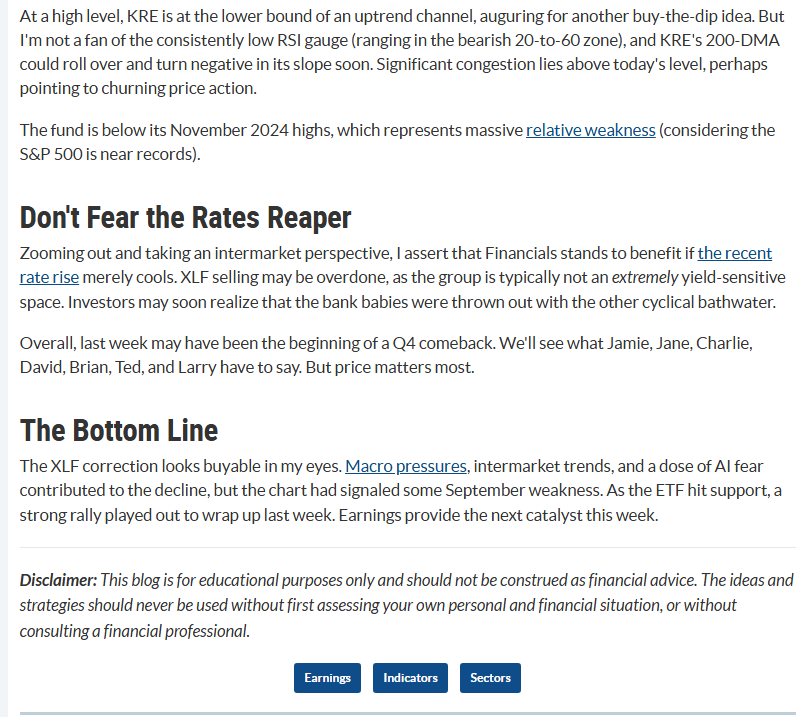
At a high level, KRE is at the lower bound of an uptrend channel, auguring for another buy-the-dip idea. But I'm not a fan of the consistently low RSI gauge (ranging in the bearish 20-to-60 zone), and KRE's 200-DMA could roll over and turn negative in its slope soon. Significant congestion lies above today's level, perhaps pointing to churning price action.
The fund is below its November 2024 highs, which represents massive relative weakness (considering the S&P 500 is near records).
**Don't Fear the Rates Reaper**
Zooming out and taking an intermarket perspective, I assert that Financials stands to benefit if the recent rate rise merely cools. XLF selling may be overdone, as the group is typically not an extremely yield-sensitive space. Investors may soon realize that the bank bellwethers were thrown out with the other cyclical bathwater.
Overall, last week may have been the beginning of a Q4 comeback. We'll see what Jamie, Jane, Charlie, David, Brian, Ted, and Larry have to say. But price matters most.
**The Bottom Line**
The XLF correction looks buyable in my eyes. Macro pressures, intermarket trends, and a dose of AI fear contributed to the decline, but the chart had signaled some September weakness. As the ETF hit support, a strong rally played out to wrap up last week. Earnings provide the next catalyst this week.
Disclaimer: This blog is for educational purposes only and should not be construed as financial advice. The ideas and strategies should never be used without first assessing your own personal and financial situation, or without consulting a financial professional.
You and @SykesMd28996 are the two accounts I most enjoy following.
$XLF $KBE "Overall, last week may have been the beginning of a Q4 comeback. We'll see what Jamie, Jane, Charlie, David, Brian, Ted, and Larry have to say. But price matters most."
My bank earnings thoughts on @stockcharts
https://t.co/gvOqRdcLYS
@TheStreet Analyst issues a severe warning, oil prices may see a major breakout. Read more: https://t.co/ObZaDfbCd1...
You and @SykesMd28996 are the two accounts I most enjoy following.
@JasonL_Capital You know what happens when $TSLA and $SPCX finally merge, right?
BREAKING: The probability of Tesla and SpaceX merging before 2028 is...
You and @SykesMd28996 are the two accounts I most enjoy following.
@zerohedge Anthropic Bans "Sustained And Needless" Cruelty Toward Claude In New Usage Policy
You and @SykesMd28996 are the two accounts I most enjoy following.
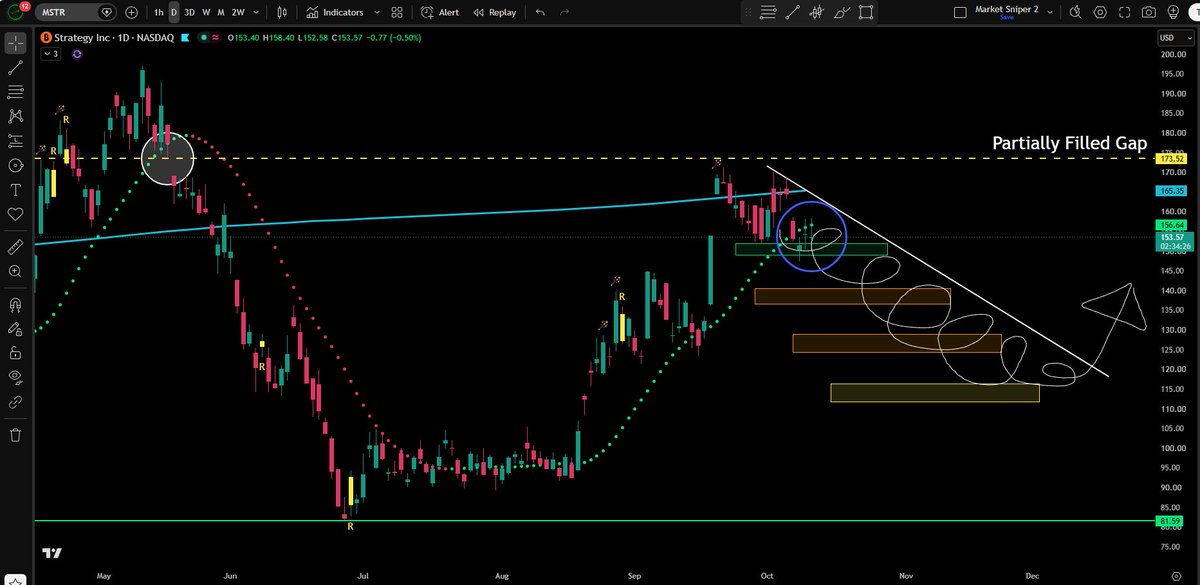
@JesseOlson $MSTR's pullback continues on the daily chart. One of the four current targets has already been hit. The wave line is still tracking the price action.
You and @SykesMd28996 are the two accounts I most enjoy following.
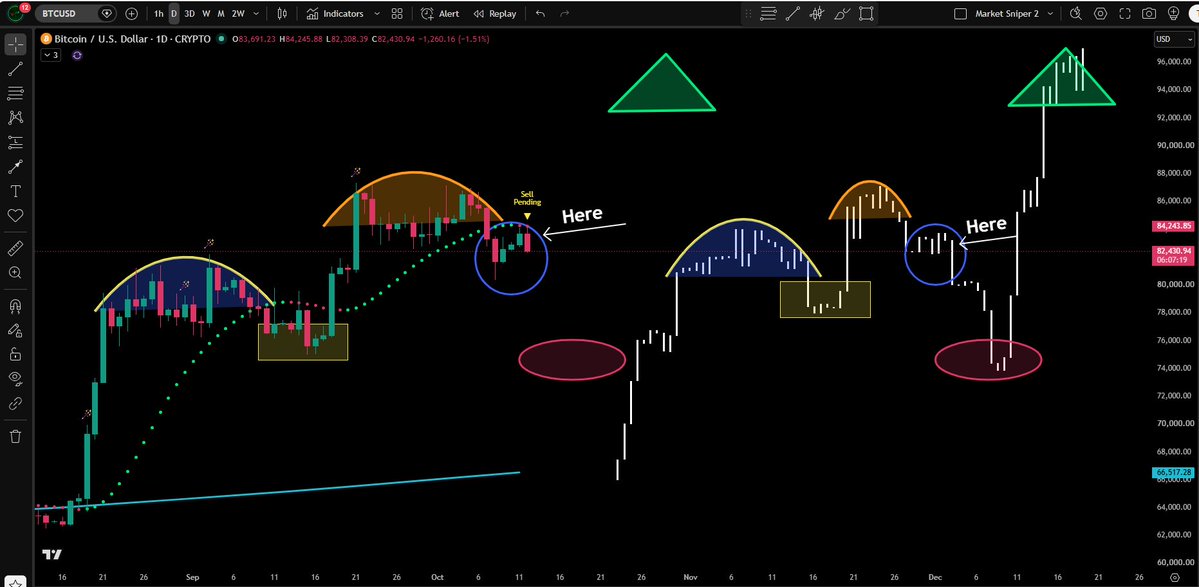
$BTC 2023 bull market fractal pattern continues to play out, similar but not exactly the same, right? If exactly the same, then the sequence is as follows: sell signal -> red oval -> V shape -> green triangle. Price is meeting resistance near the trend point.
You and @SykesMd28996 are the two accounts I most enjoy following.
$BTC 2023 Bull Fractal continues to play out similar but not exact, right?
WHAT IF it does, then here is the sequence:
Sell signal -> Red oval -> V shape -> Green triangle
Price was rejected off the trending dots.
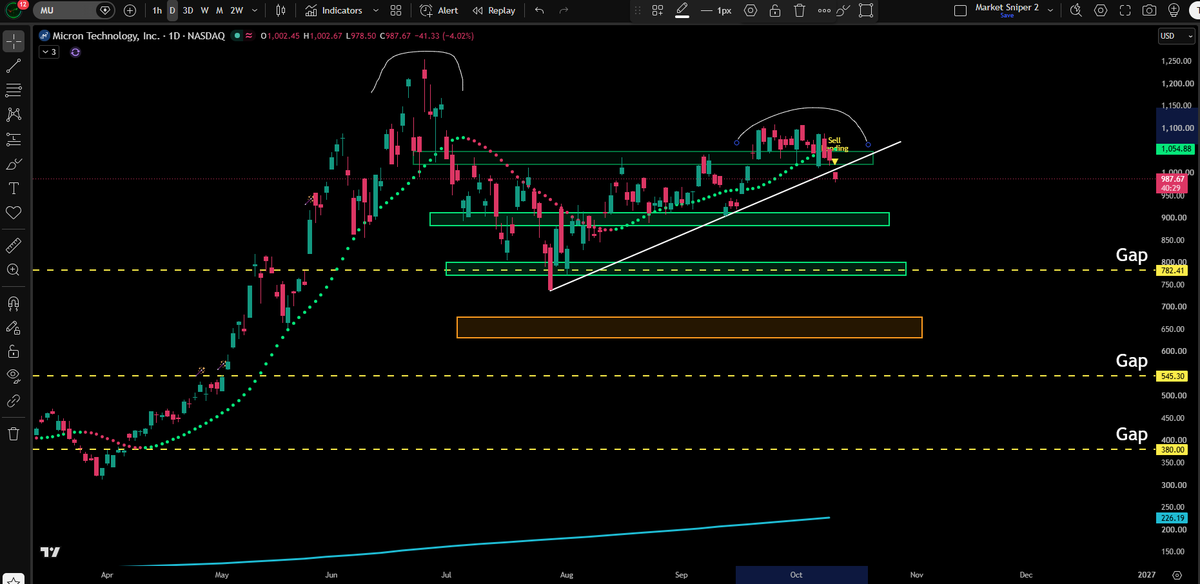
$SMU daily chart shows an existing sell signal. Three of the four target prices have already been hit. These target prices are still valid, with an effective price being the June high. Currently retesting the second target price.
You and @SykesMd28996 are the two accounts I most enjoy following.
$MU has a pending sell signal on the daily chart.
Three of four targets have been hit to the downside so far. Targets are still valid from the June top.
Retest target two in progress.
I would rather hold a few digital assets in my portfolio that truly have asymmetric upside potential and lasting value, than hold 50 stocks that look explosive but may be worthless in a few years. Concentrated investing is an advantage; diversified investing only dilutes returns and ultimately leaves you with nothing.
You and @SykesMd28996 are the two accounts I most enjoy following.