Shapefiles had a legendary run, but they’re no longer the modern GIS default due to multi-file bundles, 10-char field names, weak encoding/CRS metadata, size limits.
The path forward is cleaner: GeoPackage for durable local data, GeoJSON for the web, Parquet and FlatGeobuf for scale.
Shapefiles have officially landed on Earth. https://t.co/bqJwgFbdmk
By simply uploading a .zip file, you can render features and attributes as flexible, cloud-native data layers. This is the ultimate silo-breaker for professionals who need to combine local zoning data, property boundaries, and more to get a complete geospatial picture.
Add your first Shapefile to Google Earth now.
I am excited to introduce OpenGeoAgent, a powerful open-source multimodal AI agent for automated geospatial analysis and visualization!
It supports QGIS, Jupyter notebook, and Python scripting. In this tutorial, you’ll learn how to automate GIS workflows using natural language, generate maps, analyze satellite data, and even run complex hydrological models.
You can even interact with the agent using voice commands (no typing needed).
Video: https://t.co/mJ0ort5dzb
GitHub: https://t.co/WgiWV1wGMS
QGIS Plugin: https://t.co/qNRP3WPJWe
#geospatial #GeoAgent #OpenSource #AI
A sneak peek at the upcoming QGIS OpenGeoAgent plugin!
Run geospatial analysis and visualization using natural language, powered by over 480 geoprocessing tools from WhiteboxTools.
This brings a new level of accessibility to advanced spatial workflows directly inside QGIS, making it easier to explore, analyze, and visualize data without writing code.
Explore the projects:
• GeoAgent: https://t.co/WgiWV1wGMS
• whitebox-python: https://t.co/5ORYDDuEPI
• WhiteboxTools: https://t.co/6qE0OeDRca
Huge credit to Dr. John Lindsay @whiteboxgeo for developing WhiteboxTools!
#QGIS #geospatial #opensource
Today, we’re thrilled to announce the launch of Shapefile and 3D model import support on Google Earth. Plus, we’ve also added elevation profiles to the measure tool just for… good measure! https://t.co/vpIJA3HCv4
You’ve made it clear. You want to be able to bring more of your data and models to Google Earth’s real-world canvas. We're excited to take the next step in delivering on that promise with these new features:
🔶 Shapefiles (SHP): Render industry-standard geospatial data as performant, cloud-native layers.
💡 3D Models (GLB): Place custom architectural mock-ups, massings, and more in a visually rich context.
🗻 Elevation Profiles: View detailed terrain data in the measure tool you already know and love.
These new features are live now on Google Earth!
The GeoAI Python package now supports object detection using pre-trained models from the GeoDeep libarary (https://t.co/4qXW3ny6oP). The supported object types include cars, trees, birds, planes, aerovision, utilities, buildings, and roads. Try it out:
GitHub: https://t.co/TBxio7GvtY
Notebook example: https://t.co/ZparC9IG5W
#geospatial #geoai #opensource #python
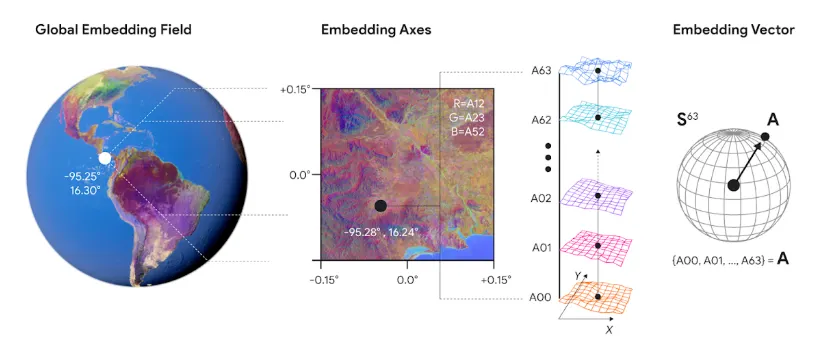
Satellite embeddings are lowering the barrier to building with Earth observation data. Discover how to build scalable, native vector search applications using Google DeepMind's AlphaEarth Foundations, Google Earth Engine, and BigQuery.
Learn from our expert partners at Spatial Informatics Group and Earth Resources Technology, Inc as they walk you through seamless Extract, Load, Transform (ELT) workflows to bring powerful geospatial insights to any app. 🚀
Read the full guide here: https://t.co/z13gtwzVlF
@BiplovBhandari@sig_gis
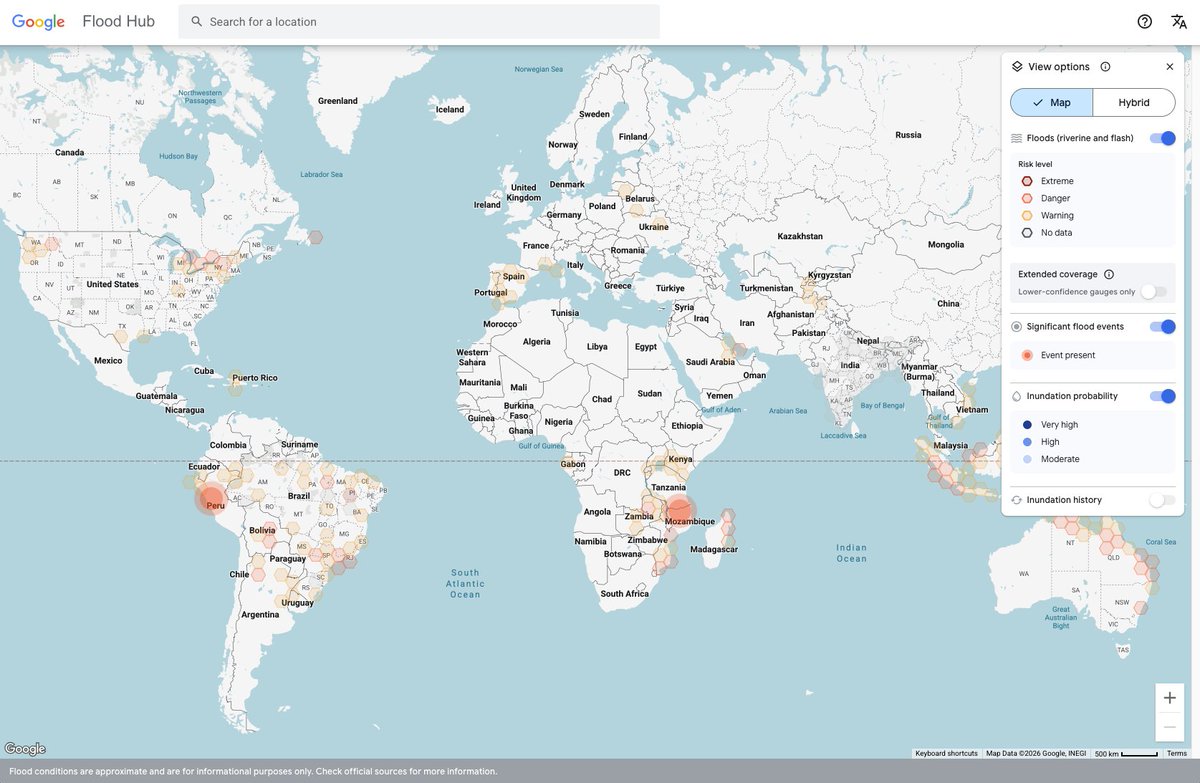
Groundsource is a new AI-powered methodology that transforms millions of public reports into a high-quality record of historical disaster data to aid crisis prediction — starting with flash floods in urban areas.
We trained a new flood forecasting model designed to predict flash floods in urban areas up to 24 hours in advance.
To help address a flash floods data gap, we created Groundsource: a new AI methodology using Gemini to identify 2.6M+ historical events across 150+ countries.
We’re open-sourcing this dataset to advance global research, and urban flash flood forecasts are live now in Flood Hub to help communities stay safe.
Free Maxar/Vantor Satellite Imagery for Disaster Response - QGIS and MapLibre Plugins Demo
Want to download free high-resolution satellite imagery in QGIS? In this tutorial, I’ll show you how to access and visualize imagery from the Vantor (formerly Maxar) Open Data Program using two powerful plugins, no programming required.
The Vantor Open Data Program provides free satellite imagery to support global disaster response and recovery efforts. These plugins make it easy to search, filter, preview, and download imagery directly inside QGIS or in web applications built with MapLibre GL.
MapLibre GL Plugin
GitHub: https://t.co/kpUPpY9IBt
Live Demo: https://t.co/FT4PwKKc8Q
QGIS Plugin:
GitHub: https://t.co/ECRrscDsS5
Plugin Page: https://t.co/QBHgBFoxyj
Vantor Open Data Program: https://t.co/KJhhiwkCcf
#QGIS #Maxar #SatelliteImagery #DisasterResponse #OpenSource
Map and image choreography is one of the surest ways to give your audience a dynamic reading experience—and ArcGIS #StoryMaps makes it easy to become a pro.
Watch the recording of our Live session where we waltz through how to make it happen: https://t.co/DHk8y0Ae2V
Following my previous post here is some good progress! Thankfully HTML Widget in #QGIS sufficiently supports #CSS#JavaScript & the built-in aggregate function, so I can visualize the #color palette for each one of the #maps inside the map catalogue table! Am I excited with QGIS!
🎁 A New Year’s gift to the geospatial community: a brand-new QGIS plugin that unlocks access to 80+ petabytes of satellite imagery and geospatial datasets with zero coding required.
In my first video of 2026, I’m excited to share what might be one of the most powerful QGIS plugins I’ve built so far. This plugin makes it incredibly easy to explore the official Earth Engine Data Catalog and the Awesome GEE Community Catalog directly inside QGIS.
With just a few clicks, you can browse massive Earth Engine datasets, visualize them on the map, generate time series from ImageCollections, export data for further analysis, and even convert Earth Engine JavaScript workflows to Python, all without writing a single line of code.
If you’ve ever wanted the power of Earth Engine inside QGIS without the learning curve, this plugin is for you.
👉 Download the plugin and follow the full step-by-step video tutorial to get started today:
QGIS Plugin Page: https://t.co/o4wrN44uZr
GitHub Repository: https://t.co/NB4shvrL7b
Video Tutorial: https://t.co/HjBHDQGMy7
Happy New Year, and I hope this tool helps you do more with geospatial data in 2026 🚀
#QGIS #geospatial #EarthEngine #Python #datascience
🚀 The QGIS Timelapse Plugin v0.2.0 has been released! 🎉 You can now overlay vector datasets (like administrative boundaries and roads) on your satellite imagery. 🌍✨
Whether you're using a local vector dataset or an Earth Engine FeatureCollection, updating is easy. Just use the plugin update checker to get the latest version and unlock this fantastic feature!
Plugin repository: https://t.co/ICEujx9Gv3
GitHub: https://t.co/nuelRto6sa
Video tutorial: https://t.co/7n6pbanNKO
#QGIS #geospatial #EarthEngine #Opensource
🚀 Watch the Earth Change: New QGIS Plugin Creates Satellite Timelapse Animations in Seconds 🌍
A QGIS plugin for creating timelapse animations from satellite and aerial imagery using Google Earth Engine. Supports NAIP, Landsat, Sentinel-2, Sentinel-1, MODIS NDVI, and GOES weather satellite imagery.
Create a timelpase animation for any location around the globe in second. Try it out:
Plugin page: https://t.co/55vGEIUruB
GitHub: https://t.co/nuelRto6sa
Video tutorial: https://t.co/kH18PnQpZZ
#QGIS #geospatial #python #EarthEngine
Here, I’m spending my holidays extracting colors with #QGIS. What’s most interesting, and immediately applicable, about studying the use of #color in old maps is their limited palette. This #map looks visually rich, yet it was created using just six colors. Less is more!