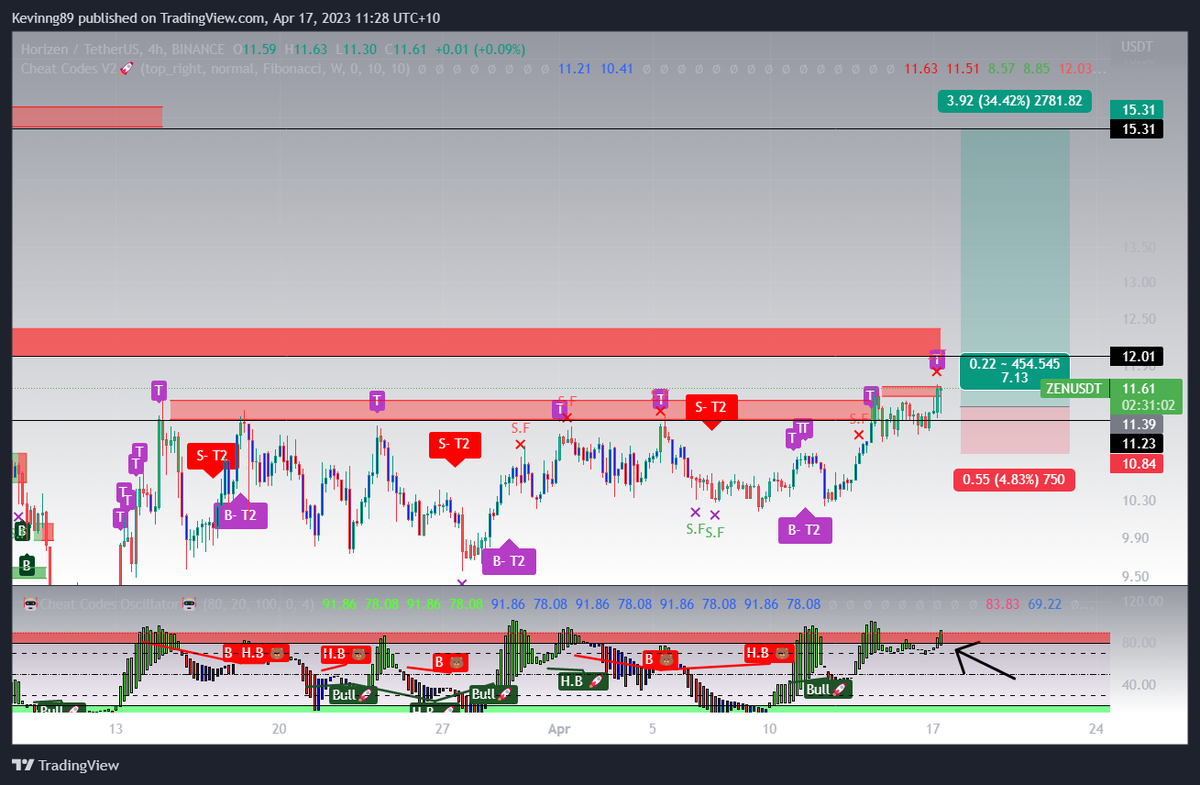
$ZEN Longed 4hr oscillator just flipped bullish and price is at support. Stops below 4hr swing lows and targets resistance above around 12 and 15.3 moon shot
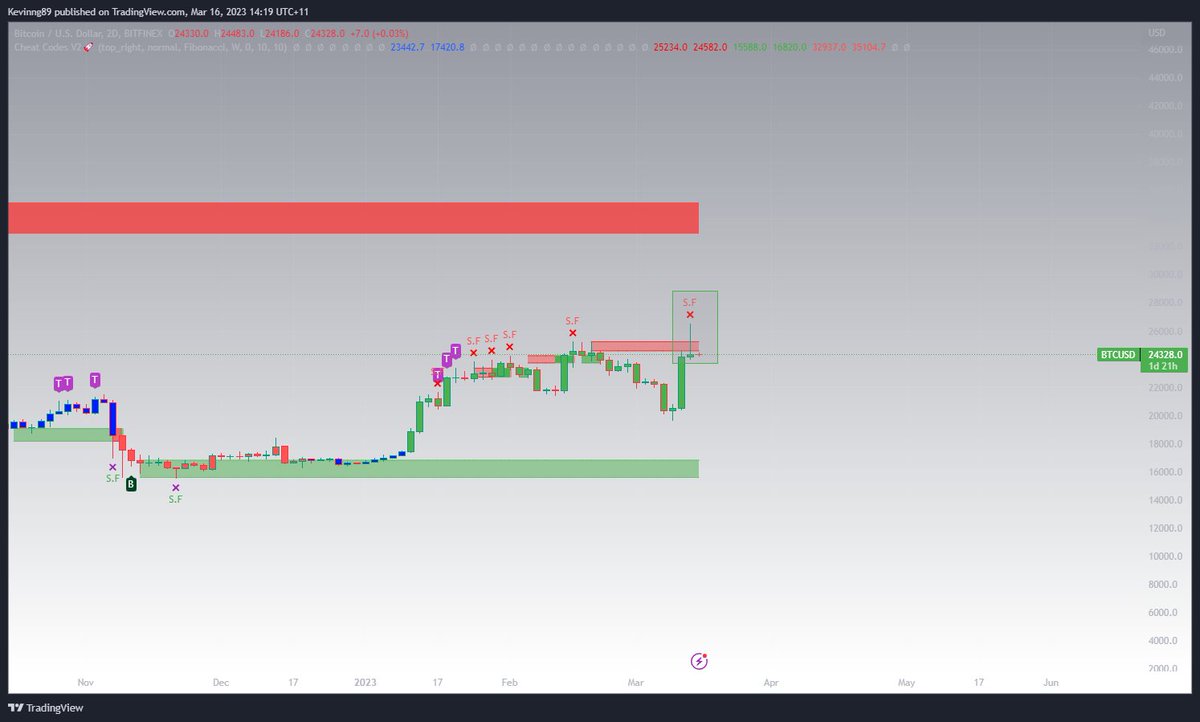
2 x Potential bottoms & 1 Swing failure on the 4h candles. Is this enough to propel $BTC to new highs?
I'm thinking it would at least go up to over 30k again from here .
What's this big ass selling wick on the $btc 2D candles?
25300-26500 area is a huge selling resistance area until proven otherwise. Better to de-risk and wait for better PA to develop imo.
You didn't believed me?
The Gaussian Channel Theory is working so far on $BTC . Price dropped more than 12% from the time i mentioned it.
If this is true , we are far from done. The lows in Nov can be tested once again #bitcoin
Where could the #bitcoin bottom be? I have spotted an interesting fractal from the bottom of the 2015 cycle.
I'm using the Gaussian Channel indicator. Chart is set to 3D candles and notice how similar the current cycle compared to the one in 2015.
If we were to repeat the 2015 pattern ,we would be retesting & possibly creating a new low under $15,300.
This would create mass panic. It will be the final capitulation & double bottom we need to end the bear market!
Follow me & retweet if you find this interesting!
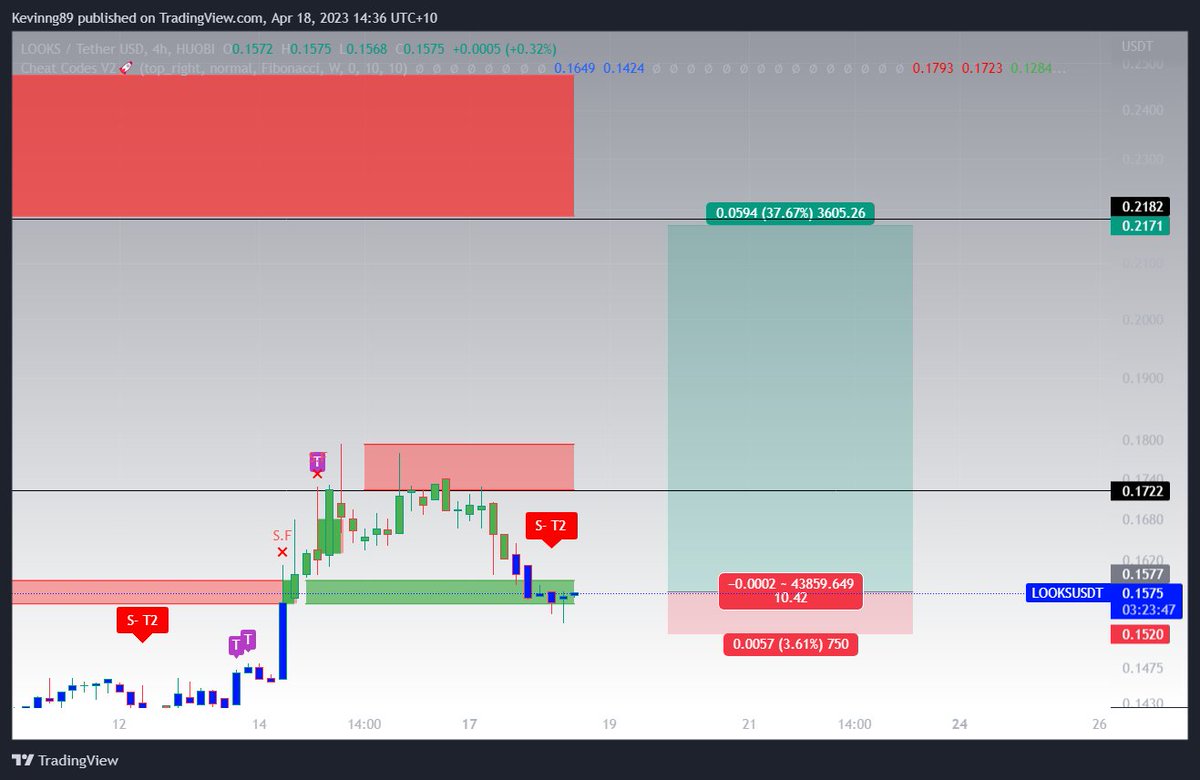
Getting some $ACH as well. Swing failure showed up and oscillator showing bullish divergence . Regardless of btc and market looking bad i'm trading according to the indicators only (only playing with small amounts)