Investing in stocks & crypto. Trading to protect/enhance gains using options, sector rotation, tail risk & alternative ETFs. Tesla weekly option trades.
Meta now makes $2.9m of revenue per employee. In early 2023 it was $1.4m. Same company, same platforms, a headcount that has barely moved... and twice the revenue per head in three years.
Ive been staring at that ratio all summer, for a different reason, and it keeps turning up in places it has no business being.. .
Amazon's Revenue Per Employee went from $292k in 2021 to $498k now, compounding at about 12% a year on 1.5 million people.
Nvidia did $1m three years ago and $5.1m last year, and if you run the latest guide against the headcount it's close to $10m per human.
The correct obvious read is that is this AI productivity showing up. But revenue per employee is a bloody strange thing to get excited about at a broader macro level. It's a company metric at first glance. It shouldn't tell you anything about a blockchain or a city or a country... except it does.
The number I use to judge a blockchain is value per active address. Cities have GDP per resident. Countries have per capita GDP too. Same instrument, pointed at a different network. Value divided by nodes.
So why does one ratio read many different kinds of network?
Because it was never a company metric. Its Metcalfe's Law as a valuation metric. If network value goes with n squared, then value per node goes with n... thats just the maths.
A network where Metcalfe is real shows rising economic density, every node added makes the average node worth more. Flat or falling density on a rising node count means the connections arent carrying anything.
And the density of revenue per employee (economic density) isn't random either. Amazon applies intelligence, Meta runs on it, Nvidia manufactures it.
Half a million per head, three million, ten million.
Density concentrates where the intelligence is produced and thins out as you move away from it.
Next time someone shows you a network by its node count, ask for the other number...how valuable each node is...
Read my new "Postcards from the Universal Code", free every month. Link below.
https://t.co/7Jklr7QSPP
Read "Anthropic says AI could double the U.S. economy every 4.5 years — but push knowledge-worker unemployment to 18%" on SmartNews: https://t.co/xPb9bVqjx8
Isaac Asimov in 1977 on what we’d do in a future where we don’t have to work - pointing out that future isn’t so different than the one we have been living in already
> Consider that there have been times in history when an aristocracy lived in idleness off the backs of flesh-and-blood machines called slaves or serfs or peasants. When such a situation was combined with a high culture, however, aristocrats used their leisure to become educated in literature, the arts, and philosophy. Such studies were not useful for work, but they occupied the mind, made for interesting conversation and an enjoyable life.
These were the liberal arts, arts for free men who didn't have to work with their hands. And these were considered higher and more satisfying than the mechanical arts, which were merely materially useful.
https://t.co/tYlcSLtsKC
This image has gone mega-viral over the last 24 hours.
If you bought Micron every day at market close and sold at market open, your return would be 138,330,342%.
If you bought Micron every day at market open and sold at market close, your return would be -99.2%.
I went down a rabbit hole to see if I could discover as to why this is.
An earlier historical dataset from researcher Bruce Knuteson produced similarly extreme results for a number of individual stocks:
• $MU: +16.2 million% overnight / -99.95% intraday
• $HOLX: +15.9 million% / -99.98%
• $NVR: +3.6 million% / -98%
• $JBHT: +3.0 million% / -99.8%
• $MGM: +2.6 million% / -99.96%
• $NVDA: +221,715% / -51%
Obviously, the exact numbers depend heavily on the period examined, but the pattern itself has been repeatedly documented.
Research published in the Journal of Investment Management found that the phenomenon is particularly strong among high-attention stocks popular with retail investors, including names such as:
$NVDA
$TSLA
$AMD
$MSTR
But here's what I didn't expect:
Over the 30-year period examined in subsequent research, $1 invested in only during regular trading hours grew to roughly $1.20.
The same $1 invested only overnight grew to approximately $17.27.
So why does this happen?
There are several theories.
One of the most interesting involves when investors actually place orders.
Retail investors often place orders during post or pre market hours.
Those orders accumulate while the market is closed and are executed around the opening auction.
That creates persistent buying pressure near the open, especially in popular, high-attention stocks.
There are a few other possible explanations as well:
• Earnings and major corporate news frequently arrive outside regular trading hours.
• Investors require compensation for accepting overnight gap risk when they cannot immediately exit a position.
• Institutional investors face different leverage, short-selling and financing constraints overnight.
• Liquidity and price impact behave differently around the opening and closing auctions.
• High-beta stocks appear to experience a particularly large day/night return split.
Researchers still disagrees on how much each explanation contributes.
Our BTC Credit model uses a 10% BTC ARR reference case, color-codes spreads by tier (Investment Grade, High Yield, Distressed), and shows BTC Floor prices below which instruments are undercollateralized. Track the impact of our capital markets actions: https://t.co/uTlyGWcQWW
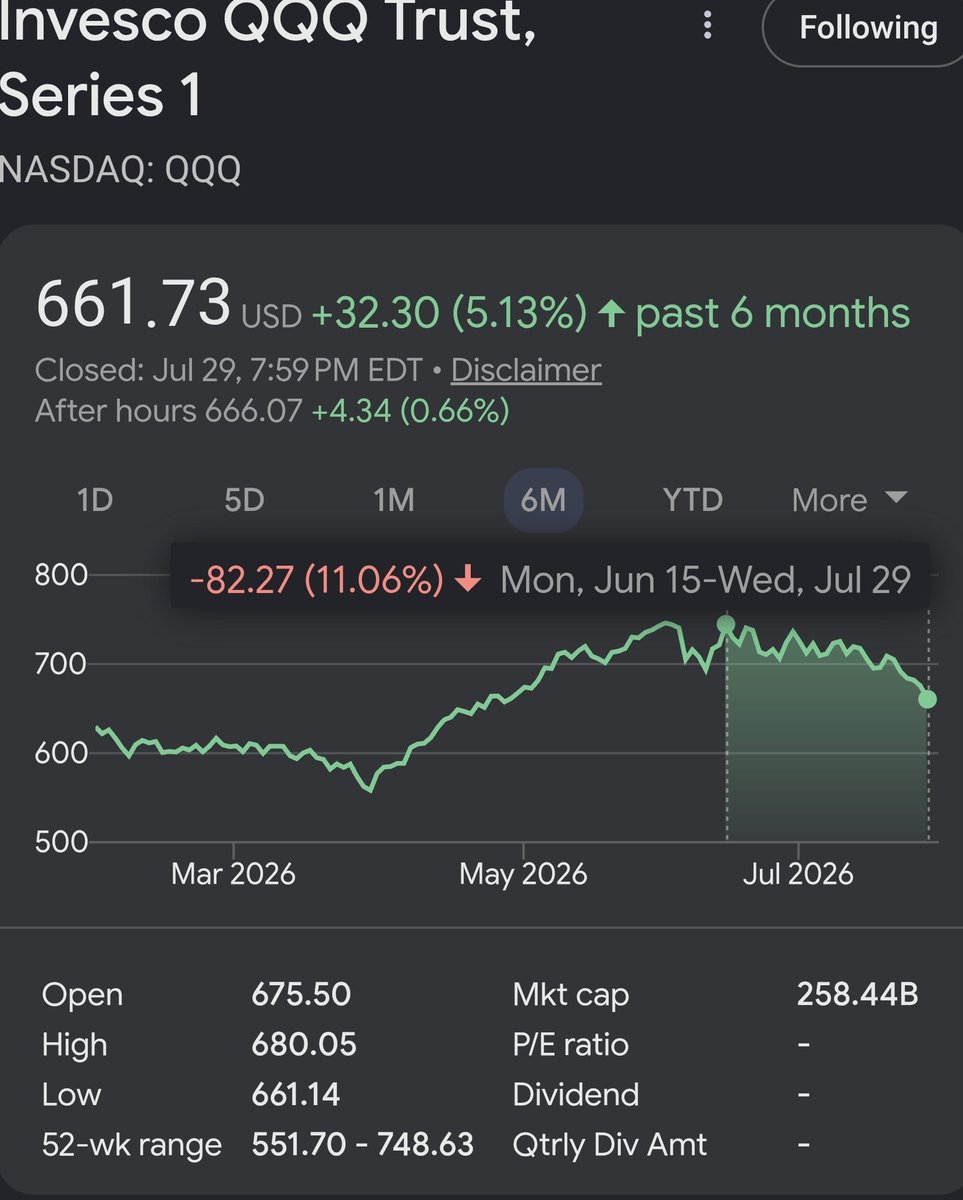
With today's sell off, $QQQ is officially in correction territory. $SPY and $IWM also sold off sharply in a volatile trading day when FOMC no rate change announcement came.
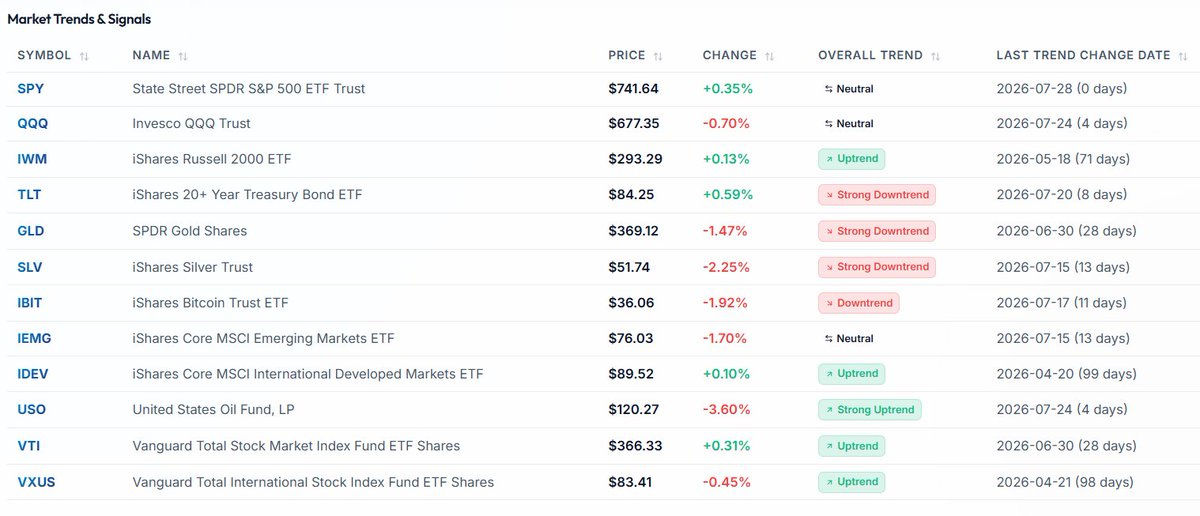
Likely change in market direction. Short term downtrend in $QQQ is alerting to be cautious. $SPY and $IWM are still in uptrend. $BTC $GLD $SLV are in confirmed downtrend but may be bottoming.
Bitcoin is 87% correlated to global liquidity. The NASDAQ is 97% correlated.
Which tells you something most people never realise. These assets are not really trading on earnings, or news, or whatever the story of the week is. They’re tracking the amount of money in the system.
Bitcoin just swings harder around that line, because on top of liquidity it is young, volatile, emotional, and still riding a network adoption curve. Sometimes it runs hot. Sometimes it runs cold. Right now it is running cold, so people think something is broken.
Nothing is broken. It’s doing exactly what it always does.
So here is the question. If these assets track liquidity this closely... what if t you could forecast liquidity itself?
Well, actually, you can.
As I lay out in my Everything Code framework, liquidity is driven by the debasement of currency, and debasement can be forecast years ahead, because the interest payments that drive it are already known today and they lead liquidity by around three years.
Bonkers.
Current trend signals for all major market indices. Small caps & international stocks seem to be holding up better than big cap and tech stocks. Oil is in strong uptrend but it can change quickly. $SPY $QQQ $IWM $GLD $SLV $TLT bitcoin:native $IEMG $IDEV $USO $VTI $VXUS