BTC / USD looks like its coming back to test the neckline of the bearish break out of the head and shoulders pattern. If it can break back above that's good news but if not expect more downside for BTC.
@CryptoKaleo The bottom is when even the die hard crypto heads stop buying and all hope is lost even upon the people who believe in crypto. This isn't complete hopelessness people still feel hope. We'll get a bounce for sure but capitulation has not happened yet.
BTC chart. Massive head and shoulders structure. This has been developing for a very long time. The support at 30 K is becoming weaker and weaker. I think that 20 K is in the cards I would be very careful touching this or any other cryptos for that matter.
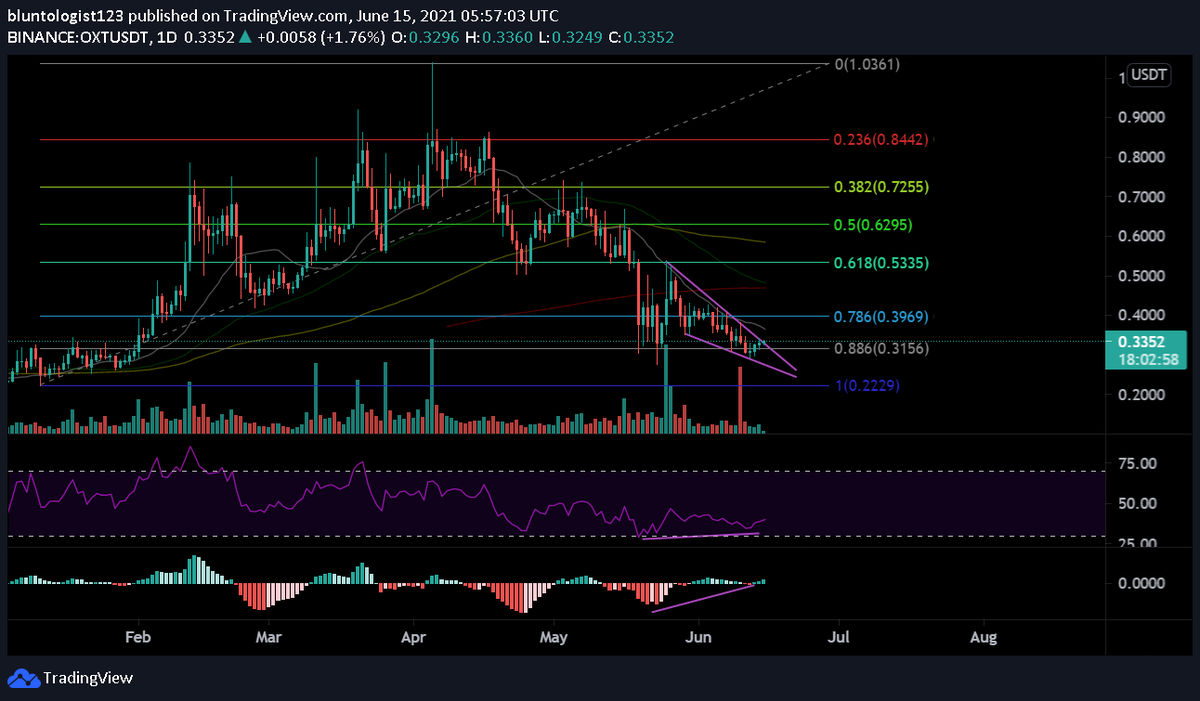
$OXT / USDT 88.6% retrace. Double bottom, falling wedge, bullish divergence on both the 4 hr and daily chart. Using old resistance as support. I am liking this one. As long as BTC doesn't do anything crazy could be a good one. 📈💰💸
So here's the deal with #BTC if BTC can not go above 42 K and hold. Going back to 30 K. If 30 K does not hold next support is 20 K. For now it looks OK Not much data but there is bullish divergence and a double bottom with a higher second low on the 4 hour chart Pray for BTC 📈🙏
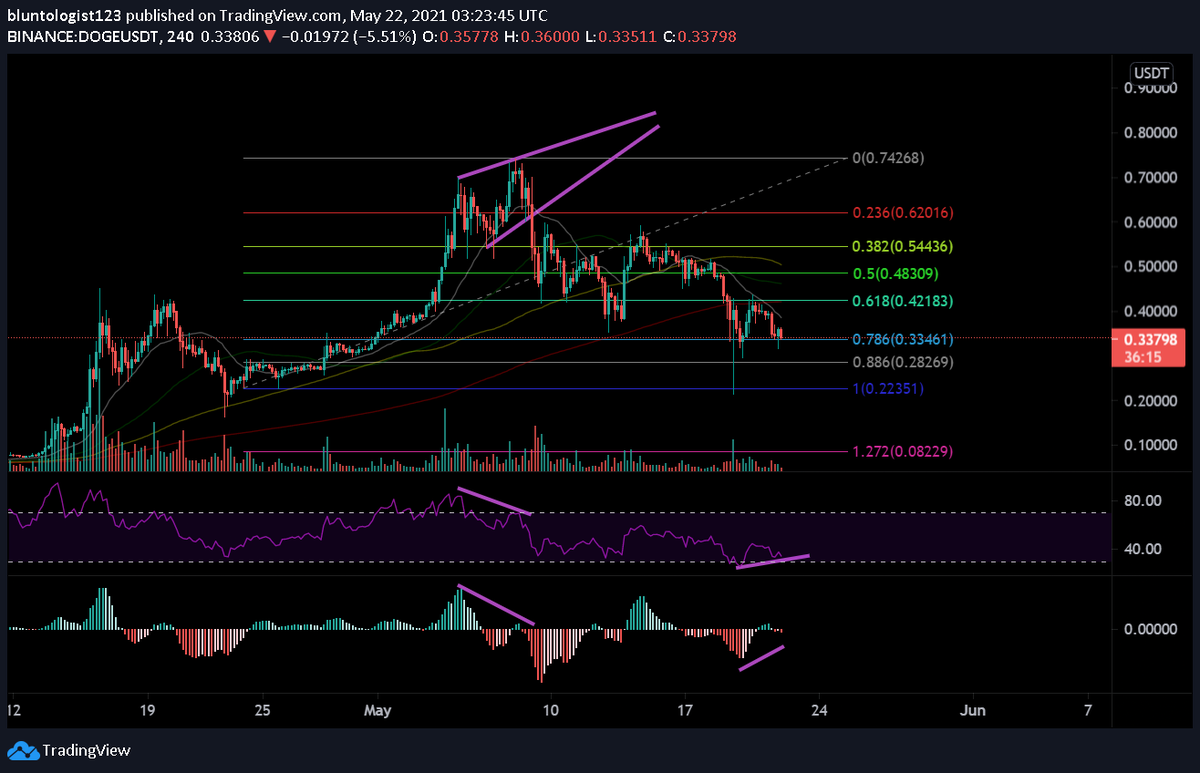
$DOGE 78.6% retrace. Bullish Divergence MACD and RSI. Double bottoming. BTCs chart also looks good for now. I think we see a #DeadDogeBounce. As long as BTC holds this may see a move to the upside.
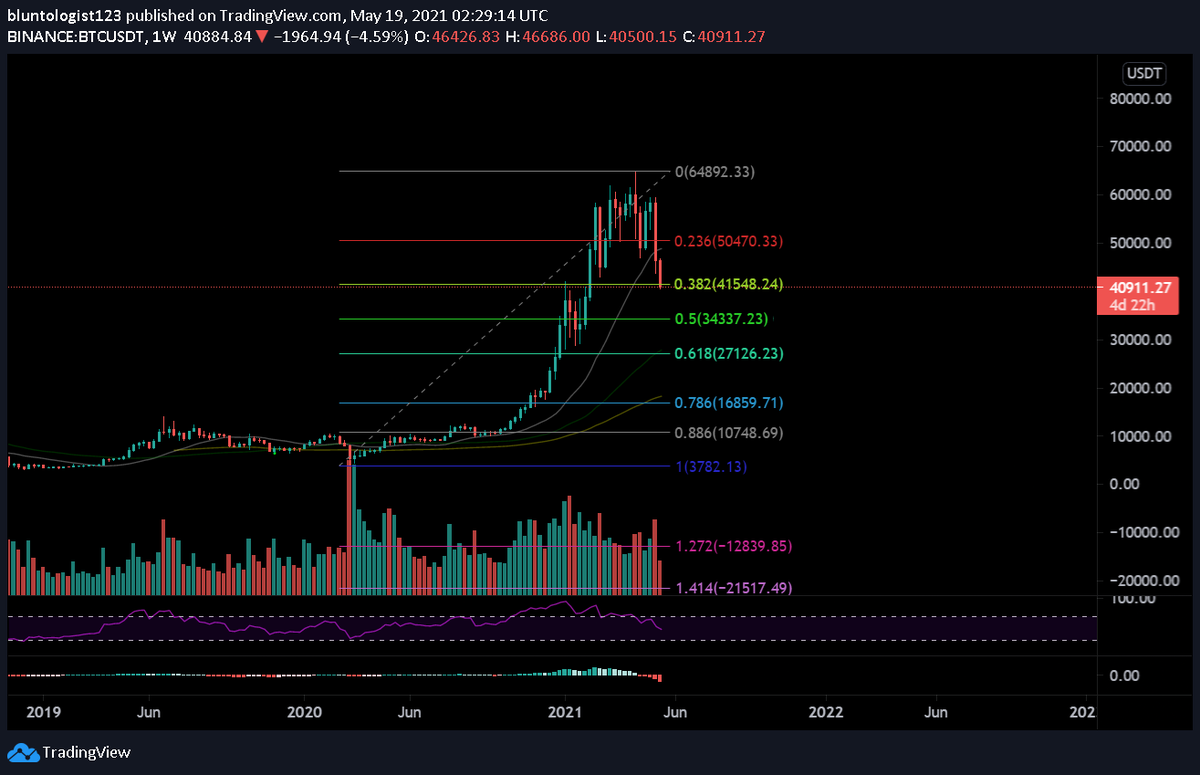
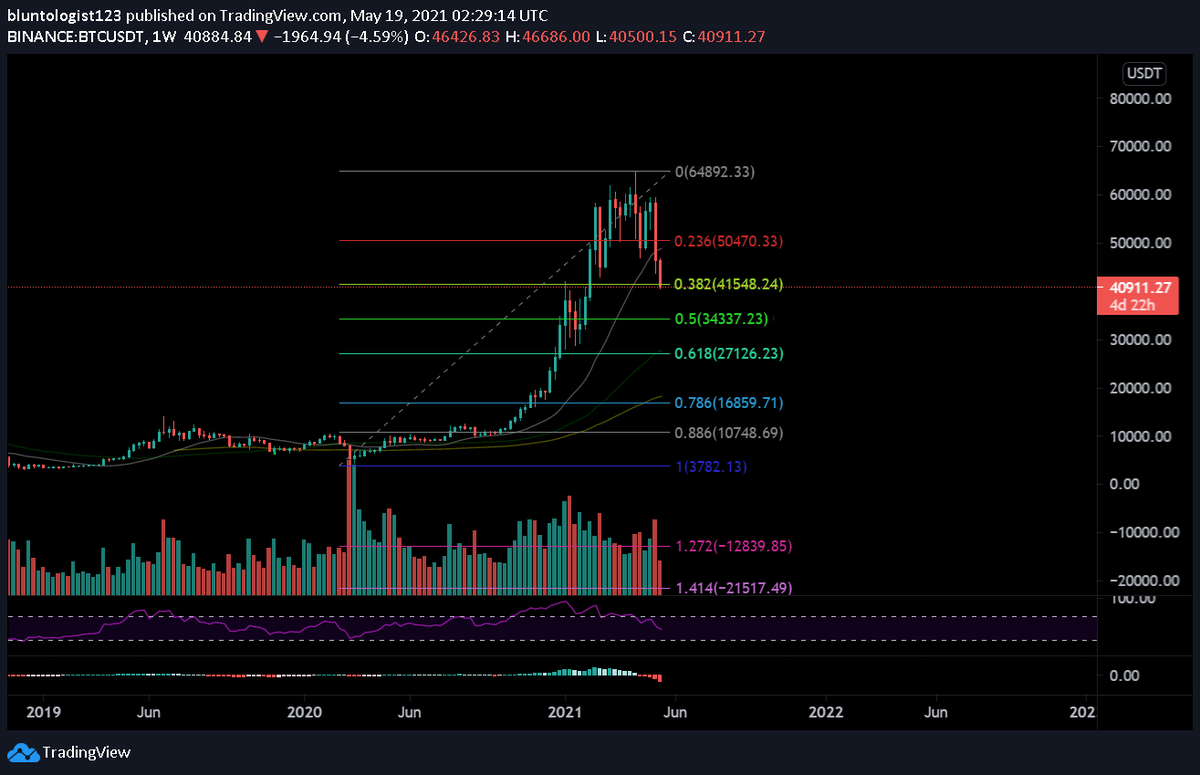
It is always important to zoom out on your chart and take a look at the big picture on $BTC. 34 K, and 27 K are common retrace areas. Any new low above 29 K is still a higher low which keeps the bull trend alive.. Lots of room to the downside still. Be careful.
@APompliano Any new low above 29 K is still bullish and would be a healthy correction. I think 34 K makes a lot of sense. 50% retrace is pretty standard.
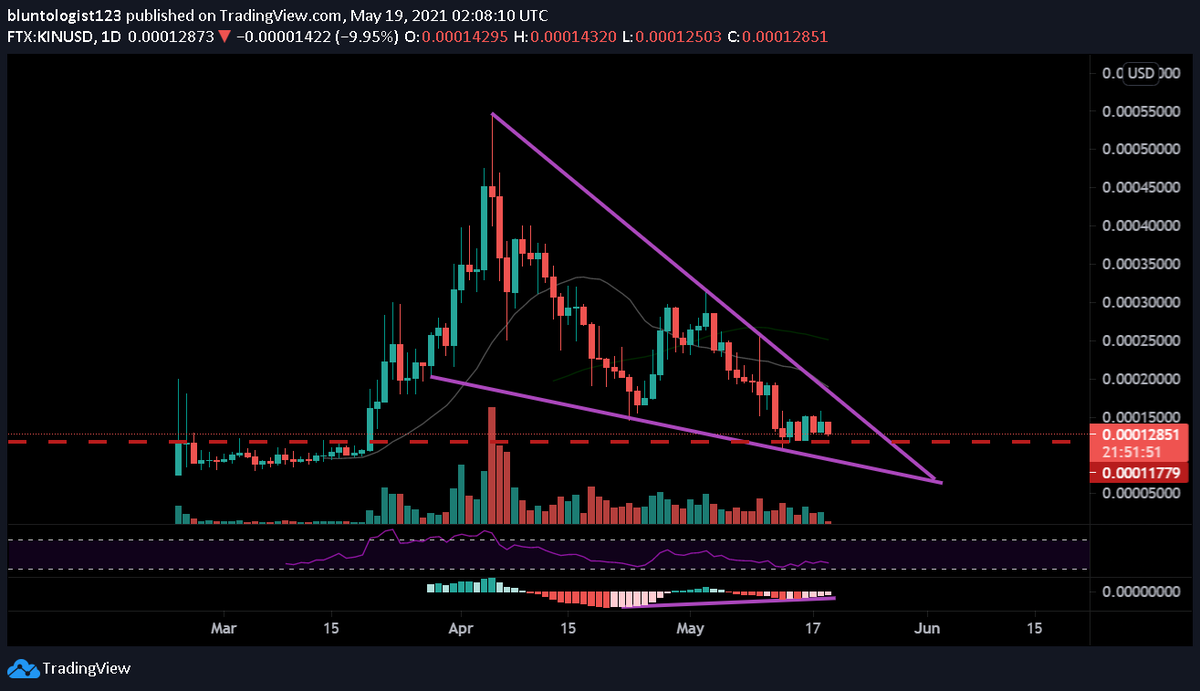
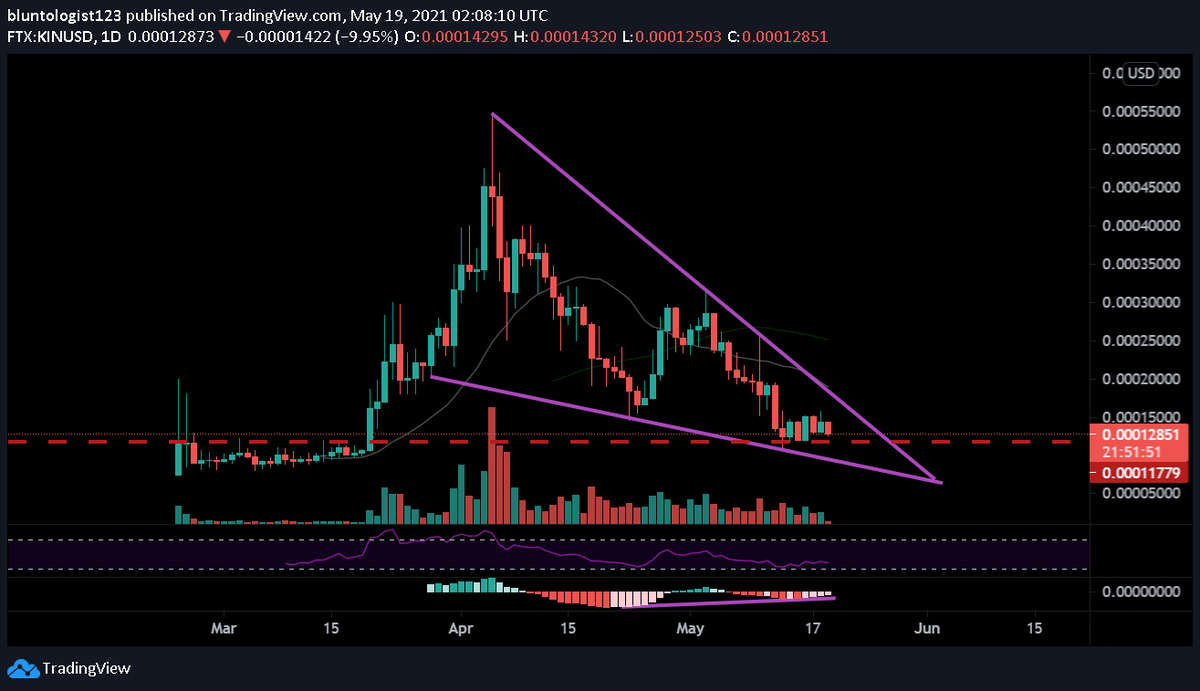
@baade_lisa Yeah this chart is really good. Text book falling wedge with bullish divergence on the MACD daily chart. Also I'm feeling how its using the old resistance as support now and has retraced so much. A lot of value in this area
$KIN / USD. Text book falling wedge pattern. Using old resistance as new support. Also forming bullish divergence on the daily MACD. Super deep value on this coin.
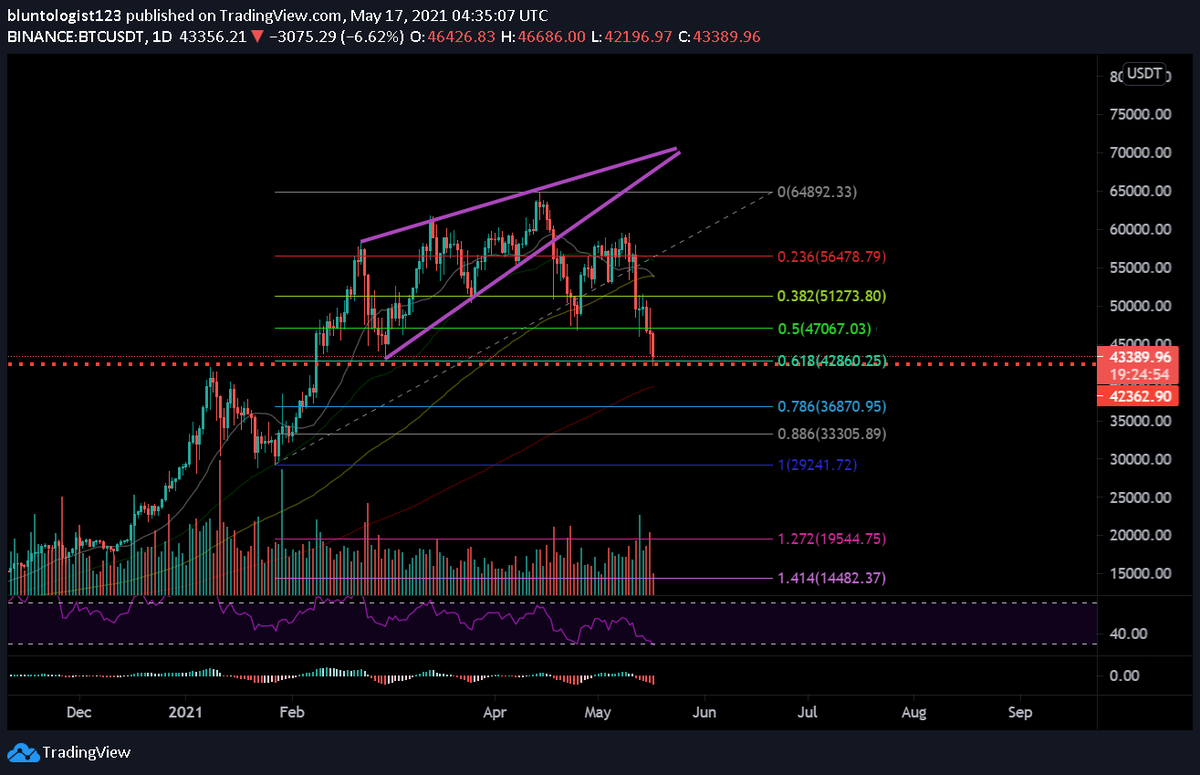
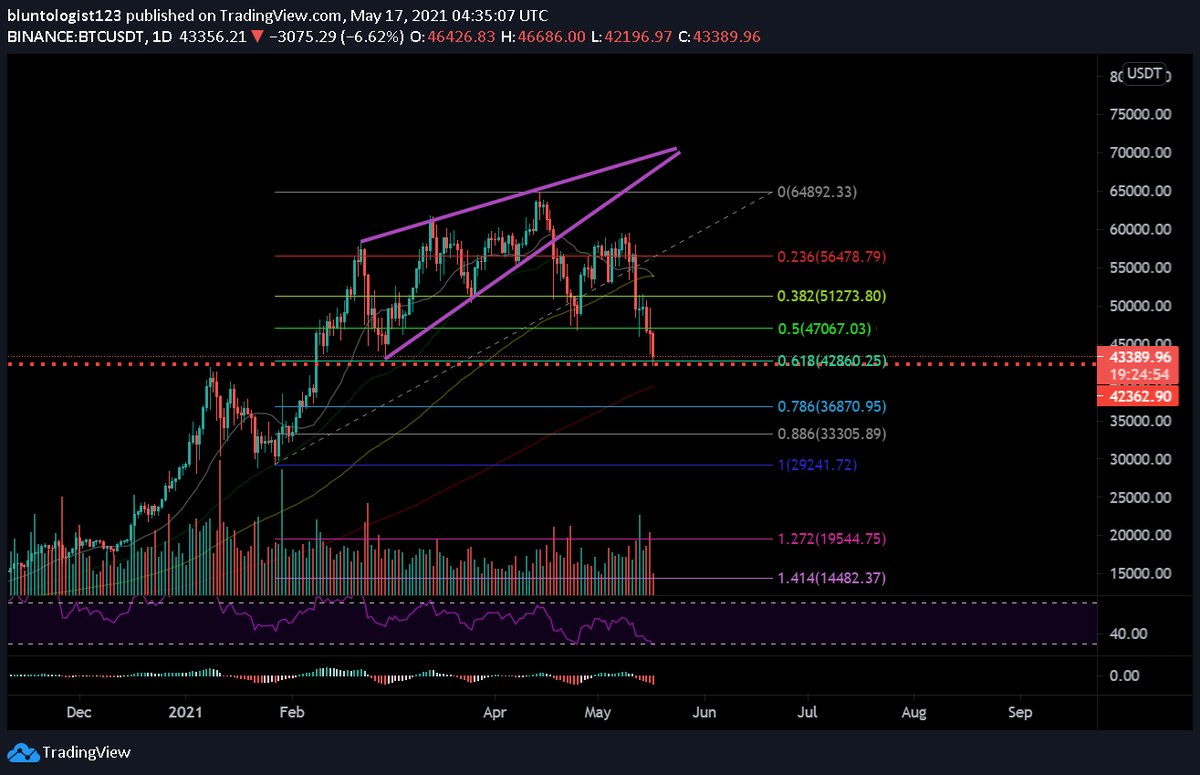
$BTC is back testing the downwards break out of the neck line of the head and shoulders pattern / channel. On the last dump it broke out of a rising wedge which measured move coincides with the 61.8% retrace. This price is at 42,600$ which is where I think $BTC is headed. 🐻📉
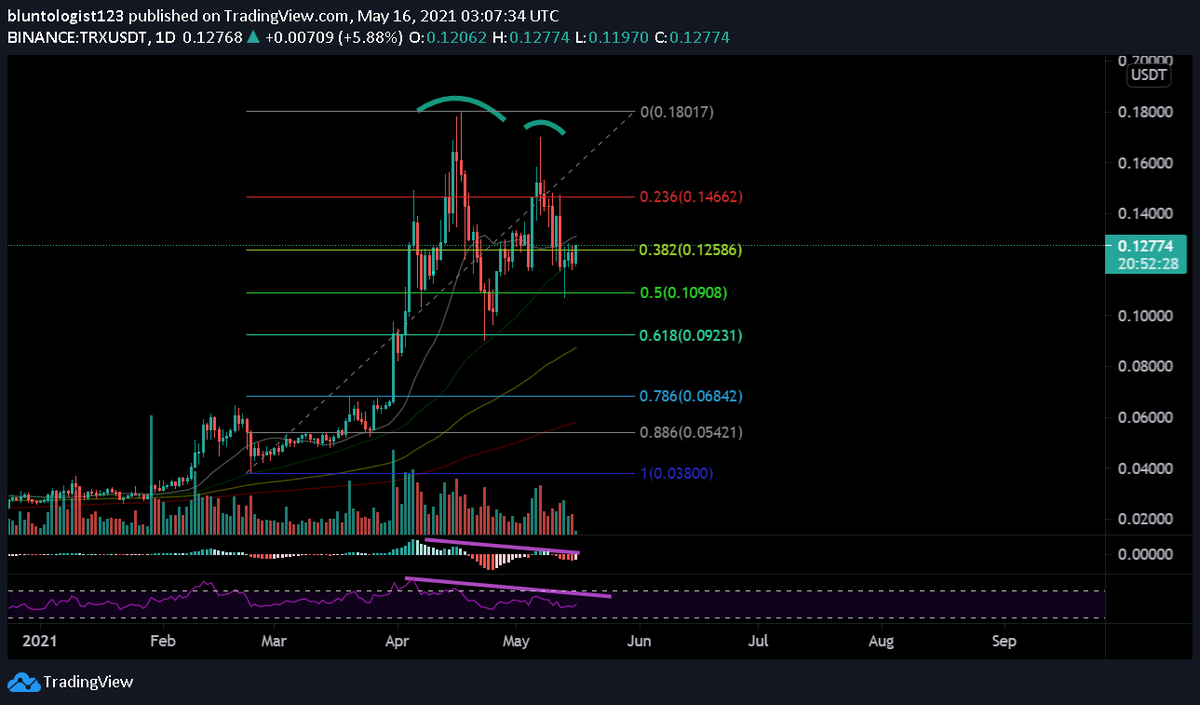
@CryptoKaleo I am seeing a double top with bearish divergence on the MACD and RSI. It would be worth taking a look at if it goes back to .0923$ and double bottoms off that 61.8% retrace.
$ETH this chart is a diamond top. Classic reversal pattern. It has been a nice run $ETH. Time for a retrace. 3240$ and 2972$ targets to the downside. 🐻📉🔥💵
$LINA / USDT. Double bottom. Bullish divergence on the MACD and RSI daily chart. There is also triple MACD bullish divergence on the 4 hour chart. Worth taking a look at but with BTC chart being so uncertain ATM proceed with caution. If BTC dies so do all your alt coins.