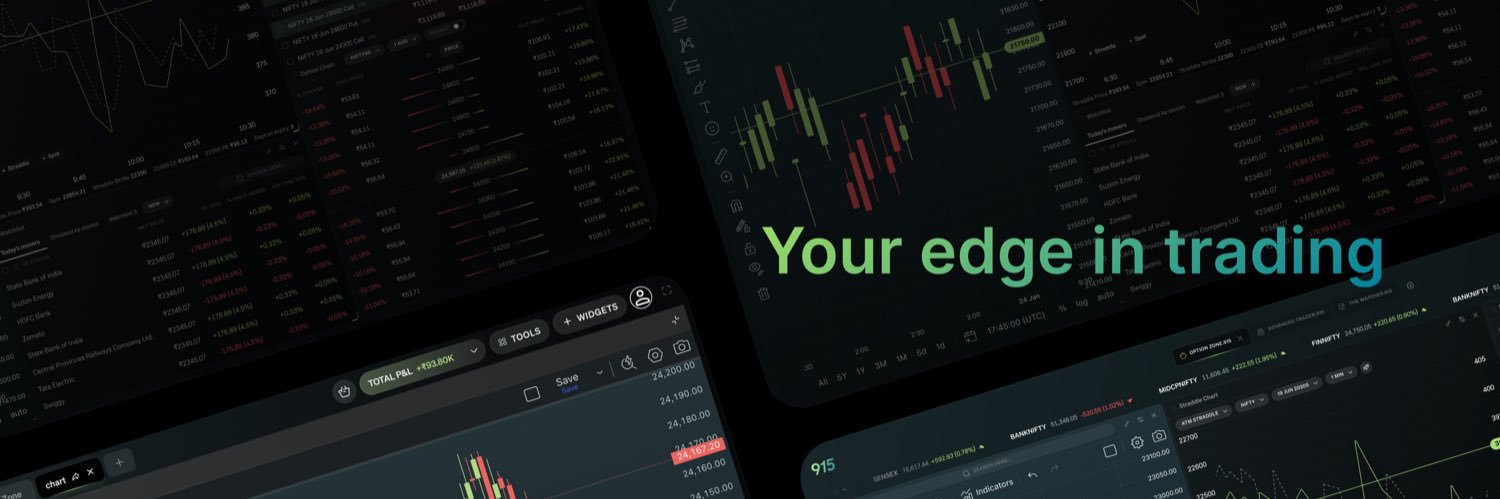
Customize. Configure. Conquer. 🚀
With 915, pick your widgets, rearrange tabs, drag & resize panels, and split intraday & positional P&L into dedicated tabs. Trade on your terms.
#915Terminal
Missed today's selloff?
The warning signs were already on the 915 News Widget nearly 2 hours ago, as negative news started hitting the tape.
By the time most traders noticed the move, Nifty had already done the damage.
News moves markets. Fast access matters.
#NIFTY #StockMarket #Trading #915
This Day That Year
On 8 July 1932, the Dow Jones hit its Great Depression low.
Not 20%.
Not 40%.
Not 60%.
Almost 90% from its high made in 1929.
Crazy part - It took more than two decades to reclaim that high.
Long term can test your patience far more than you ever imagined.
When the day starts with suppressed vols and the index stays rangebound, the ATM straddle should usually decay.
Today, the Nifty straddle has traded around 70–75 despite no meaningful move in the index.
Is the market preparing for a range expansion?
The takeaway:
❌ RSI > 70 doesn't automatically mean "sell."
❌ RSI < 30 doesn't automatically mean "buy."
✅ RSI tells you about momentum.
Stop treating RSI as a reversal indicator. Start using it as a momentum indicator.
5/5
Market Myth Monday 🧠
Every Monday, we bust one popular trading myth -- with data, logic, and market evidence.
Today: Debunking the RSI myth.
Most people think
• RSI > 70 = Overbought → Sell
• RSI < 30 = Oversold → Buy
That's not how RSI works🧵
1/5
The opposite is also true.
During strong bear markets, RSI can remain below 30 for extended periods.
Buying simply because RSI looks "cheap" often means catching a falling knife.
Instead of asking - "Is RSI above 70?"
Check if there is divergence in price and RSI? If price is making a higher high and RSI is making a lower high - that’s a bearish divergence. Bearish divergence is an early warning, not a sell signal.
The same holds true for bullish divergence.
4/5
RSI doesn't tell you whether a stock is expensive or cheap.
It tells you how strong the recent move has been.
Think of it as a speedometer, not a valuation meter.
Strong momentum can stay strong far longer than most traders expect.
2/6
#LTF looks interesting here - preparing itself for highest weekly close.
From ~200 in Aug last year to ~320 in Jan, /the stock had already delivered a strong move followed by 6 months of correction/consolidation.
If this breakout sustains, this may mark the start of the next leg. What do you guys think?
This Day, That Year
Do you know it's Gift Nifty's third anniversary today?
On 3rd July 2023, SGX Nifty officially became GIFT Nifty. For years, Indian traders were hooked on to SGX Nifty every morning to take a guess on Nifty’s opening. Then the contract moved from Singapore to India.
5/5
Final verdict - This clearly was not a fresh fundamental shock but more like a delayed ADR catch-up after the India buyback adjustment.
Important nuance:
It was probably not a formal ADR ratio adjustment. It was market repricing.
India adjusted first. ADR followed later.
This is the reason Wipro India did not open with a similar price correction but ended up opening just about flat.
4/5
That explains the weird gap.
Rough numbers comparing the two much prior to the buyback announcement -
5 Mar:
ADR around $2.2
India stock around ₹193
After ADR fall:
ADR around $1.87
India stock around ₹170
The percentage moves now look much more aligned.
So the ADR may not have “crashed late” because of new information.
It may have finally been repriced similar to what India had already done.
Adani Enterprise - Stock ran up in a straight line fashion from 1800 to 3000 in 3 months and then consolidated in the month of the June. Coming out of consolidation, is the stock starting a fresh leg up?