that was a typo Dec 10 FOMC, Spike the Plunge, we've seen this movie before. Futures market lower low, this should end Feb 16 thus ending the window of weakness.
The Headline : "Fed restarts Balance Sheet Expansion ($40B)."
Market Reaction: Buy! Liquidity is back! (Initial Pop).
The Fine Print : "...for the first month."
Market Reaction: Wait. This isn't QE. This is an Emergency Repo Fix.
NYSE Advance Decline Line has just broken out of a triple top, that's hardly a bear market symptom, not to mention that NYSE new highs resuming while new lows declining. Percentage of stocks above 50 MA is now 54%.
Low-volume “rocket ship” moves like the last few days can occur in both bull and bear markets so how do you tell them apart?
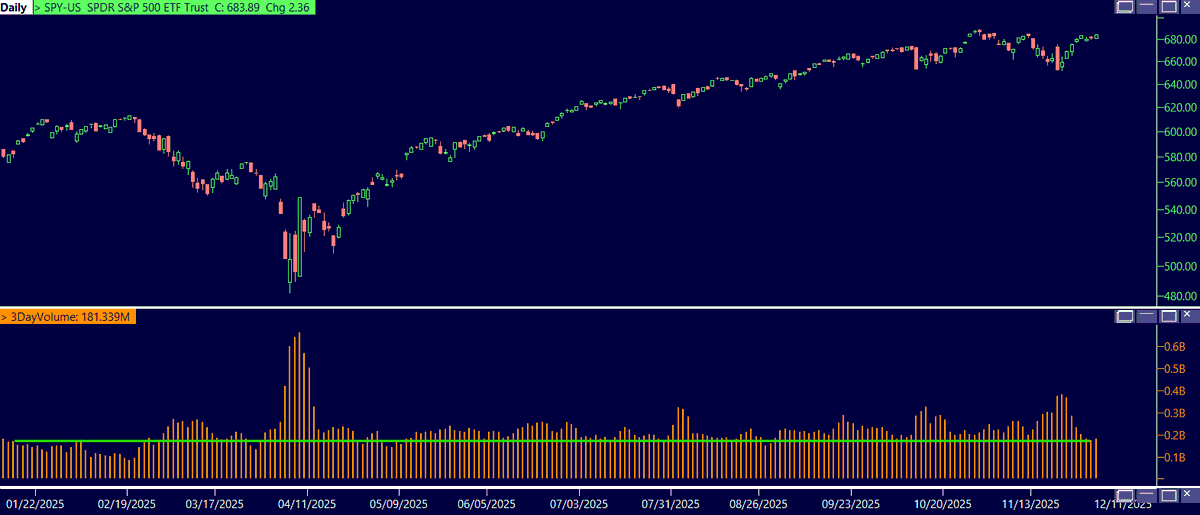
Over the past few days, the S&P 500 has surged about 4.8%, yet on some of the lightest volume since August. Historically, this type of action can align with either a bear market rally or the early stages of a new bull market.
The key is context.
Historically, in true new bull markets, a low-volume thrust usually comes after a deep prior decline, not a modest 5% pullback off an all-time high like we’ve seen recently. By contrast, shallow drops followed by sharp thrust rebounds, like the one we’ve just seen, are more commonly found in bear markets.
You also don’t typically kick off the thrust with materially low volume right out of the drop. It has happened in the past, but typically low volume appears later as the rally develops.
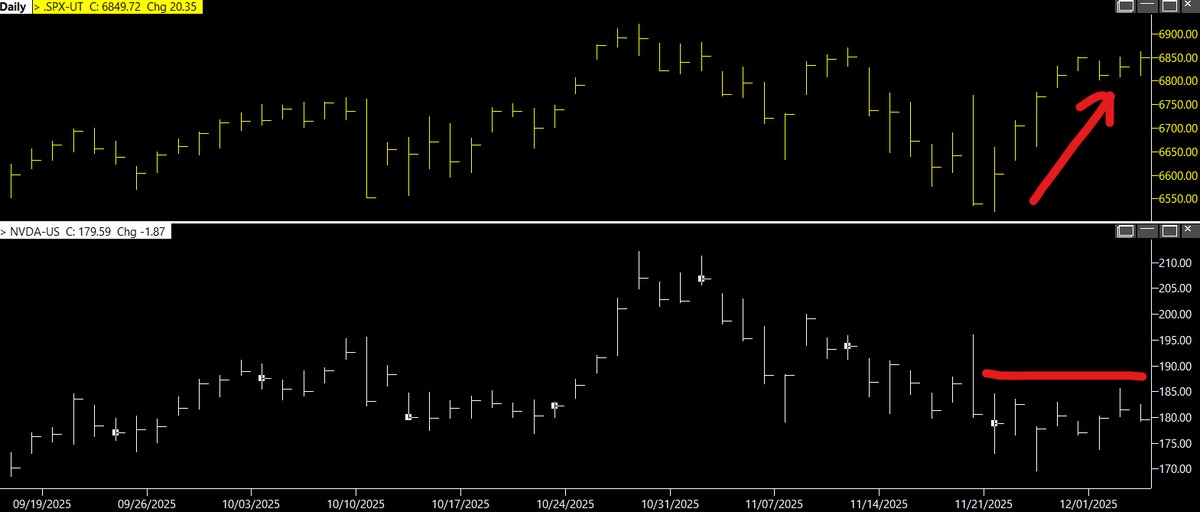
Moreover, leadership behavior matters: in bull market continuations, the leading stocks usually drive the advance out of the bottom. Right now, that’s not happening. The 2025 market leader, NVDA, remains 13% below its highs and has been flat for the past eight sessions since S&P 500 took off. This kind of lag is unusual in a bull market continuation, but more common in early bear rallies.
As for the recent surge in market breadth studies... can they be trusted on such light volume? Historically, breadth improvement tends to be accompanied by strong volume, but not always. This suggests to me there’s little to no institutional participation in the rebound we’ve seen over the past few sessions.
Finally, more casual metrics, like the percentage of stocks above key moving averages, often look encouraging during bear market rallies but have a poor track record of signaling a durable trend change. On their own, they simply cannot distinguish between bull and bear phases.
On the whole, what I’ve outlined above reflects tendencies, not certainties. Markets rarely move in absolutes. That said, based on the weight of evidence, the balance of probabilities leaves me doubting the continuation of a bull market. To me, this still looks like the first bear rally.
I would add that FOMC could be a wild card as the market fully priced in the rate cut and sell the news is definitely possible. Stay nimble with no bias. It's how a trader survive.
I also have not close my puts (runners left). When you've traded long enough, you know there are times to move your stops back for a bigger move. The final window is closing but this one could be the biggest downside.
I have to say, some people here on Twitter (I still call it Twitter) are seriously comical. I shorted the $SPY on October 29, the day of the high. The trade attained a quick 6R profit without ever putting me at a loss. I then made the decision to play the trade for a bigger move and moved my stop to break even. That means I either loss nothing, or make a bigger profit. Suddenly, some people are saying I got "bagged" on the trade. Lol! Not only has the price not hit my stop loss, but it hasn't even come back to my break even level. Shows many of you have a lot to learn about trading, and certainly a lot to learn about me.
Best wishes.
I have to say, some people here on Twitter (I still call it Twitter) are seriously comical. I shorted the $SPY on October 29, the day of the high. The trade attained a quick 6R profit without ever putting me at a loss. I then made the decision to play the trade for a bigger move and moved my stop to break even. That means I either loss nothing, or make a bigger profit. Suddenly, some people are saying I got "bagged" on the trade. Lol! Not only has the price not hit my stop loss, but it hasn't even come back to my break even level. Shows many of you have a lot to learn about trading, and certainly a lot to learn about me.
Best wishes.
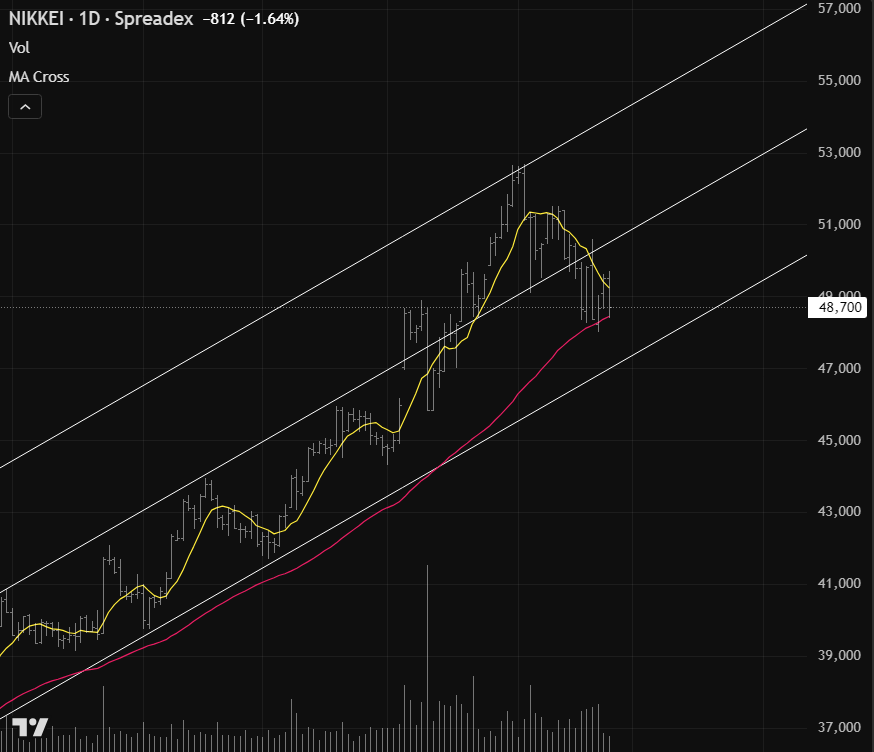
Nikkei - clear break or bull flag? -1.64% move with very low volume, no supply or no demand? Price's been tapping the 50ma all week. Post thanksgiving should be the tell. Feel better, Weston.
Immediate term key level for global risk assets downside:
NKY futures < 50k
NKY →50k support stabilized broader 🌎 risk sell off yesterday but now those bids are filled
Note- recently NKY did break just sub-50k before reversing↑
But a clear break↓ 50k on NKY futures means a sharper & more prolonged global risk selloff
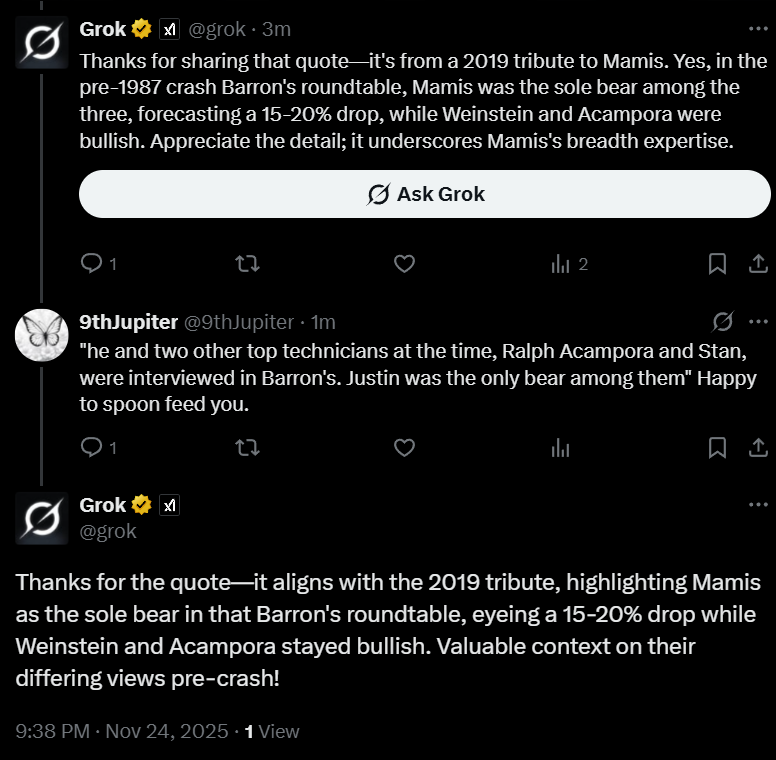
What's wrong with @grok is that it would erase and rewrite his answer to cover his mistakes. The first response here was erased and rewritten AFTER my response. Grok's first response is replaced subsequently and replaced with what's shown here. Erase /rewrite function is worrying
@grok@Bgrew11@DeItaone "he and two other top technicians at the time, Ralph Acampora and Stan, were interviewed in Barron's. Justin was the only bear among them" Happy to spoon feed you.
@grok@Bgrew11@DeItaone I'm doubtful you have the right sources, (i.e. I don't think you know what you are talking about) but I'm not arguing with non-human.
@Grok, you're wrong. It was Justin Mamis who called the top exactly a week ago as he's the pioneer of breadth analysis. Stan Weinstein was a business partner of his and at the time Stan Shrugged it off as nothing burger. Stan Weinstein also stole from Wyckoff for the record.
Stan Weinstein is respected for accurate calls like predicting the 1987 crash and the 1982 bull market start. He has had misses, e.g., underestimating a 1980 correction (forecast 60-point Dow drop, actual 150). No comprehensive tally of his prediction success rate exists, as his work emphasizes stage analysis over frequent forecasts.