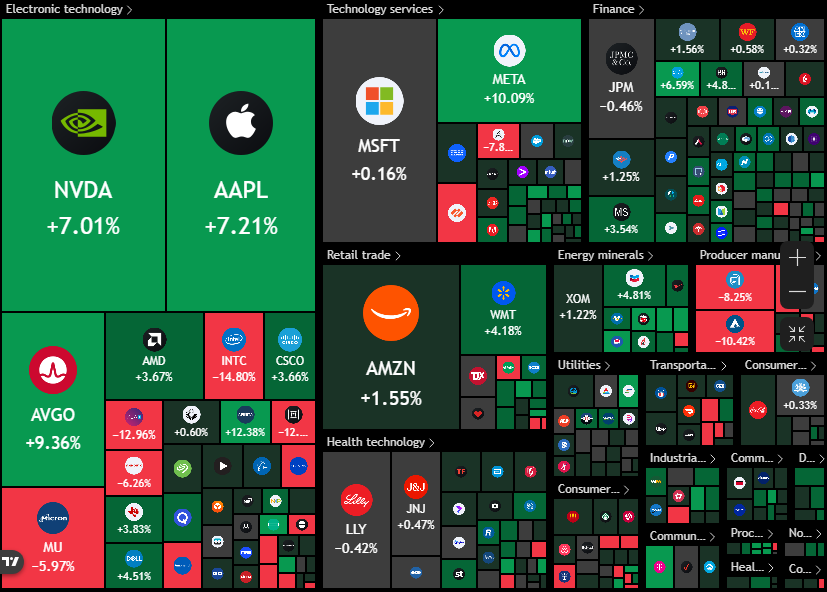
Big tech is resuming market leadership:
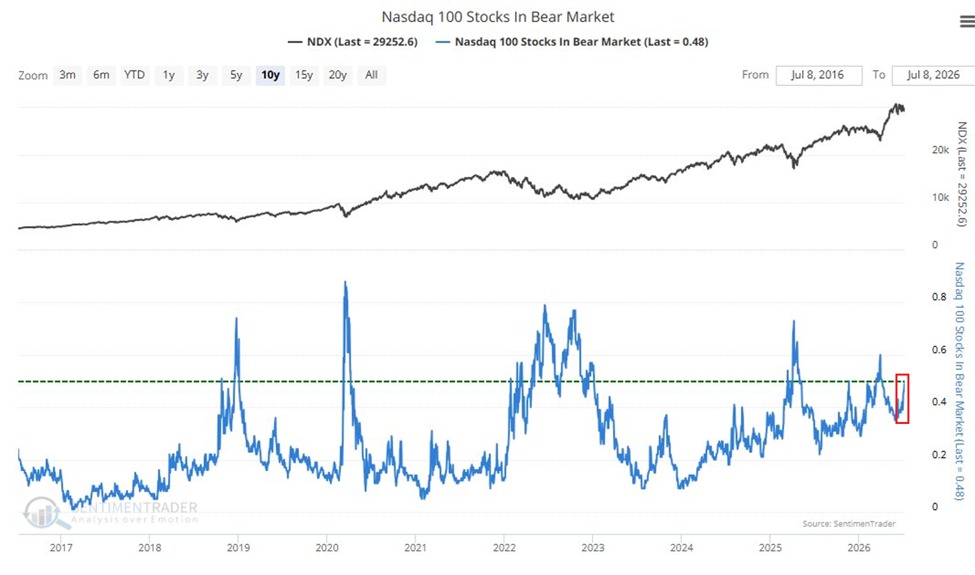
The proportion of Nasdaq 100 stocks trading at least -20% below their peaks is up to 48%, the highest since the February-March selloff.
This percentage has doubled over the last 12 months, though it remains below the 60% recorded before the late-March market bottom.
By comparison, during the 2022 bear market, this metric surged to as high as 80%.
This comes despite 64% of Nasdaq 100 stocks still trading above their 200-day moving average, near the highest reading of the year.
To put this into perspective, only 38% of index constituents were trading above their 200-day moving average before the market bottomed on March 30th.
The rally is becoming increasingly dependent on a shrinking group of stocks.
BREAKING: The Bank of Japan's total assets dropped -$146 billion in Q2 2026, to $3.97 trillion, the lowest since Q1 2020.
This also marks the largest quarterly decline since the Quantitative Tightening (QT) program began in August 2024.
Since the Q1 2024 peak, the BoJ has reduced its balance sheet by -$726 billion, or -15.6%.
Japanese government bond holdings fell -$78 billion in Q2, to $3.22 trillion, the lowest since Q3 2020.
Since the 2023 peak, JGB holdings have dropped -$459 billion, or -12.5%.
The BoJ also sold -$74 million in equity ETFs and J-REITs last quarter, bringing its holdings down by -1.0%, to $234 billion, the lowest since 2022.
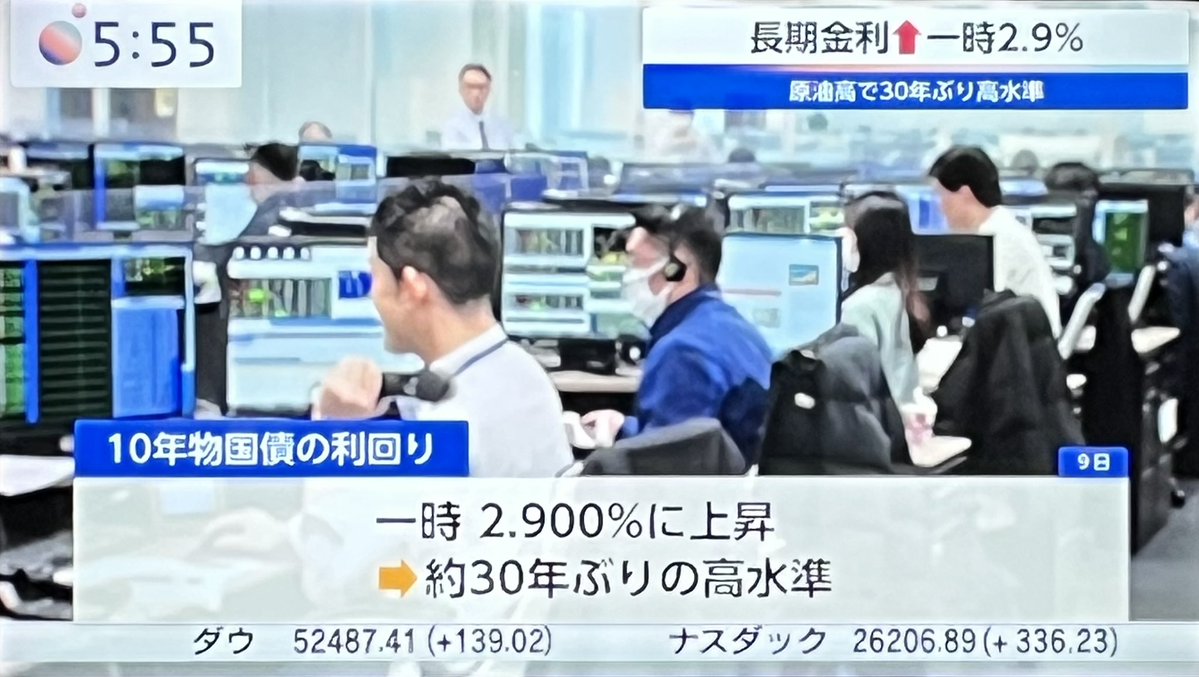
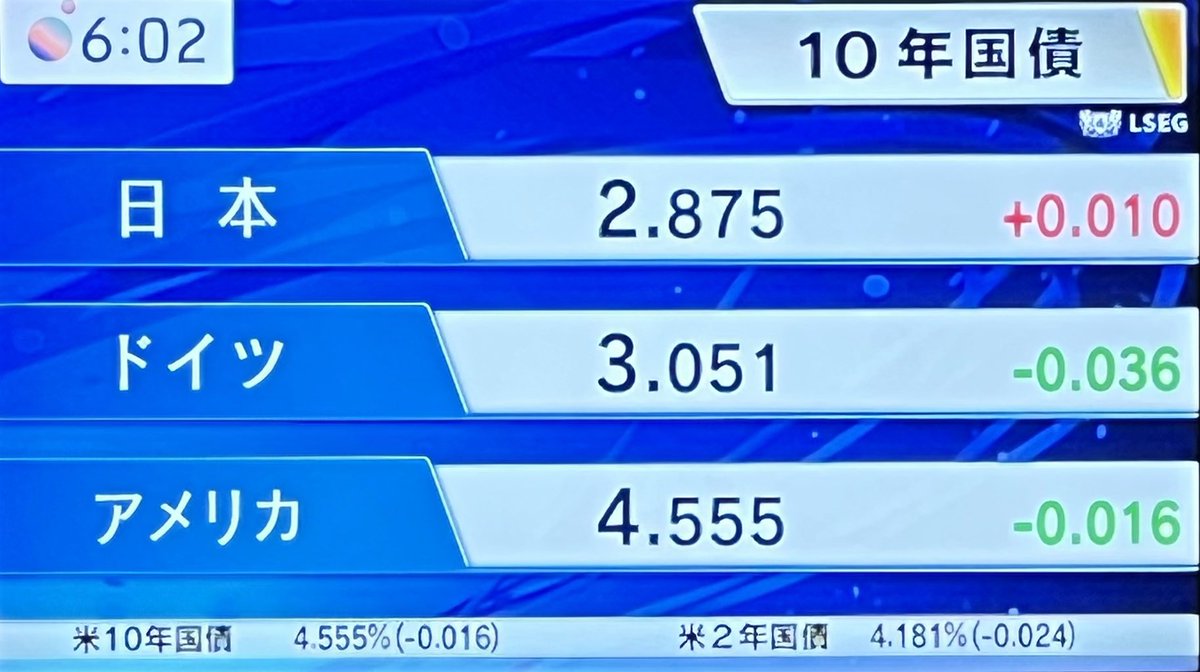
Japan’s bond market is poised for more volatility.