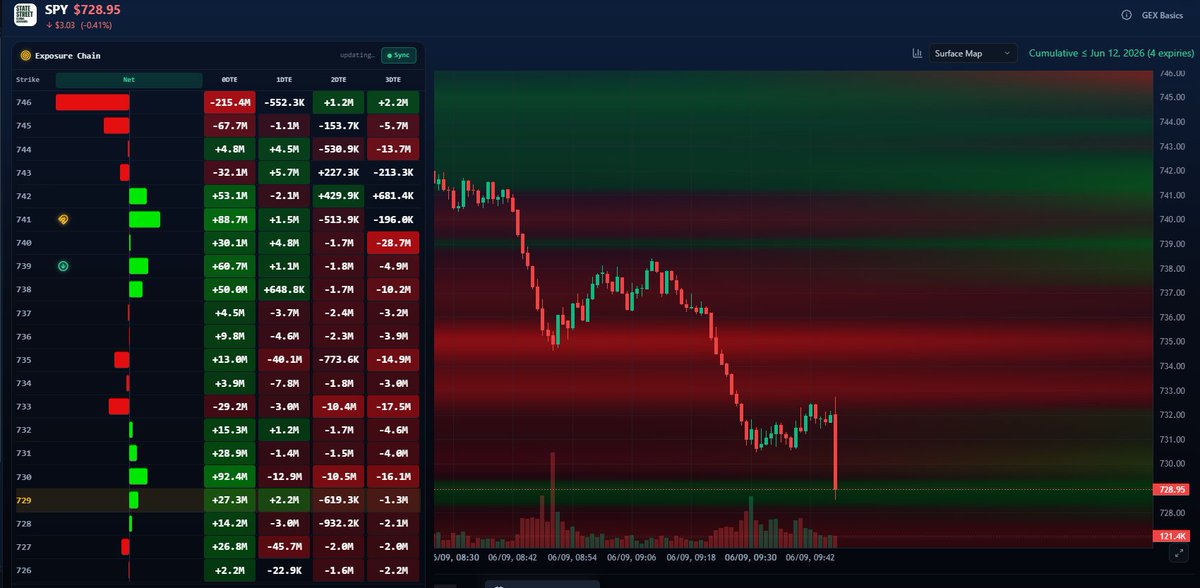
Introducing a visualization of cumulative gamma exposure across all expiries as a live topographic surface — with a heat-generated overlay showing exactly where dealers are forced to hedge.
This is where the edge starts.
Heatmap (Surface Map) | https://t.co/lJ7lwvZD48
$SPY
⚡ Limited-Time Offer — 35% Off First Month
Markets move fast. So should you.
For a limited time, new members get 35% off their first month of Nexsen Terminal — full access to real-time options flow, live market positioning, smart-money tracking, and our entire collection of intelligence suites.
Use code >> NEXSEN35 << at checkout.
👉 Claim your spot at https://t.co/W2Tgd6xPt8
Offer ends soon. Slots are limited.
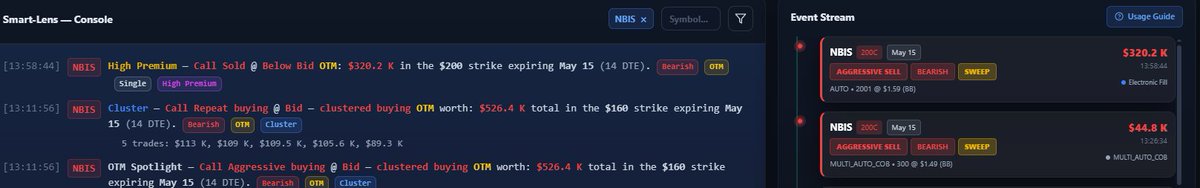
$NBIS | Covered Call — Systematic Premium Capture May 15 Expiration | 12 DTE | $200 Strike
At current market price of $154.49, our Strategy Builder on Nexsenterminal identifies the $200 Call as a high-conviction premium capture opportunity with a 100% probability of profit at expiration — a risk/reward profile that demands attention.
With $NBIS trading nearly $45.51 below the strike, the probability of this call finishing in-the-money within 12 days is negligible under current volatility conditions. The P&L graph reflects exactly that — a flat, fully green profit zone across virtually every price scenario up to $200. The position only faces meaningful pressure in an extreme, low-probability upside event.
This is disciplined, asymmetric risk management. Maximum loss is defined. Premium is collected on entry. Time decay works in the seller's favour from the moment the position is opened.
Institutional-grade probability analysis, real-time flow data, and defined-risk structuring. All in one terminal.
https://t.co/u0SuEIqnUZ - Strategy Builder
#daytrading #spy #options
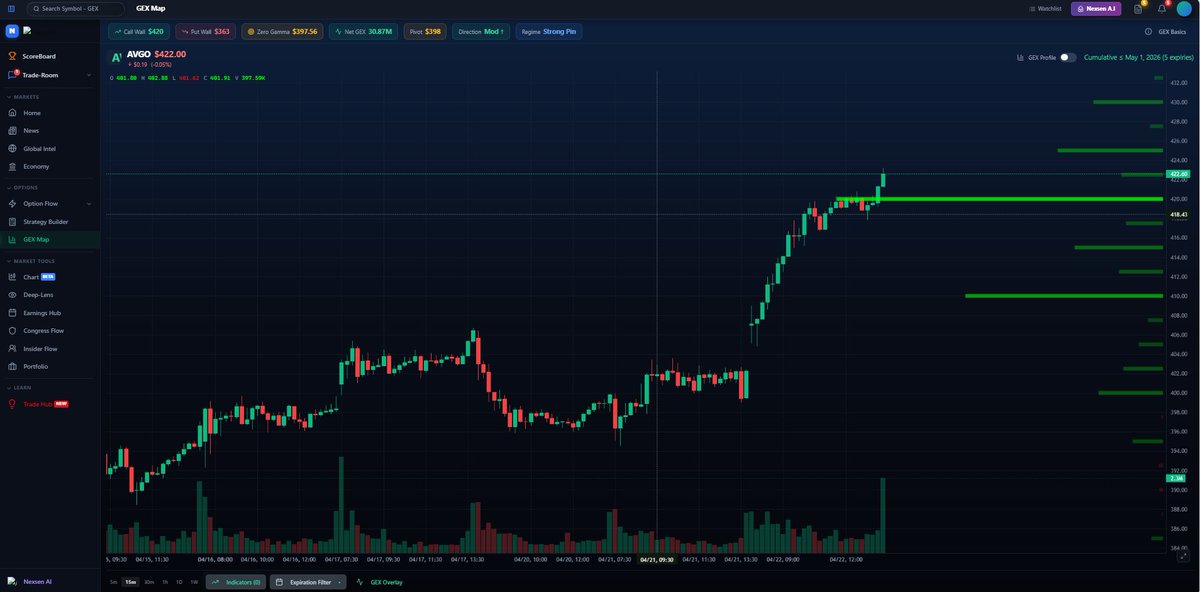
Just an absolute grinder for #AVGO, had a large GEX wall for this weeks expiry at $420 level (shows that dealers are hedged to upside).
Price then does exactly what we expect, making an 20 point move to the upside, only at https://t.co/iHksOyYn3l
@IncBulls
$spy $qqq $avgo
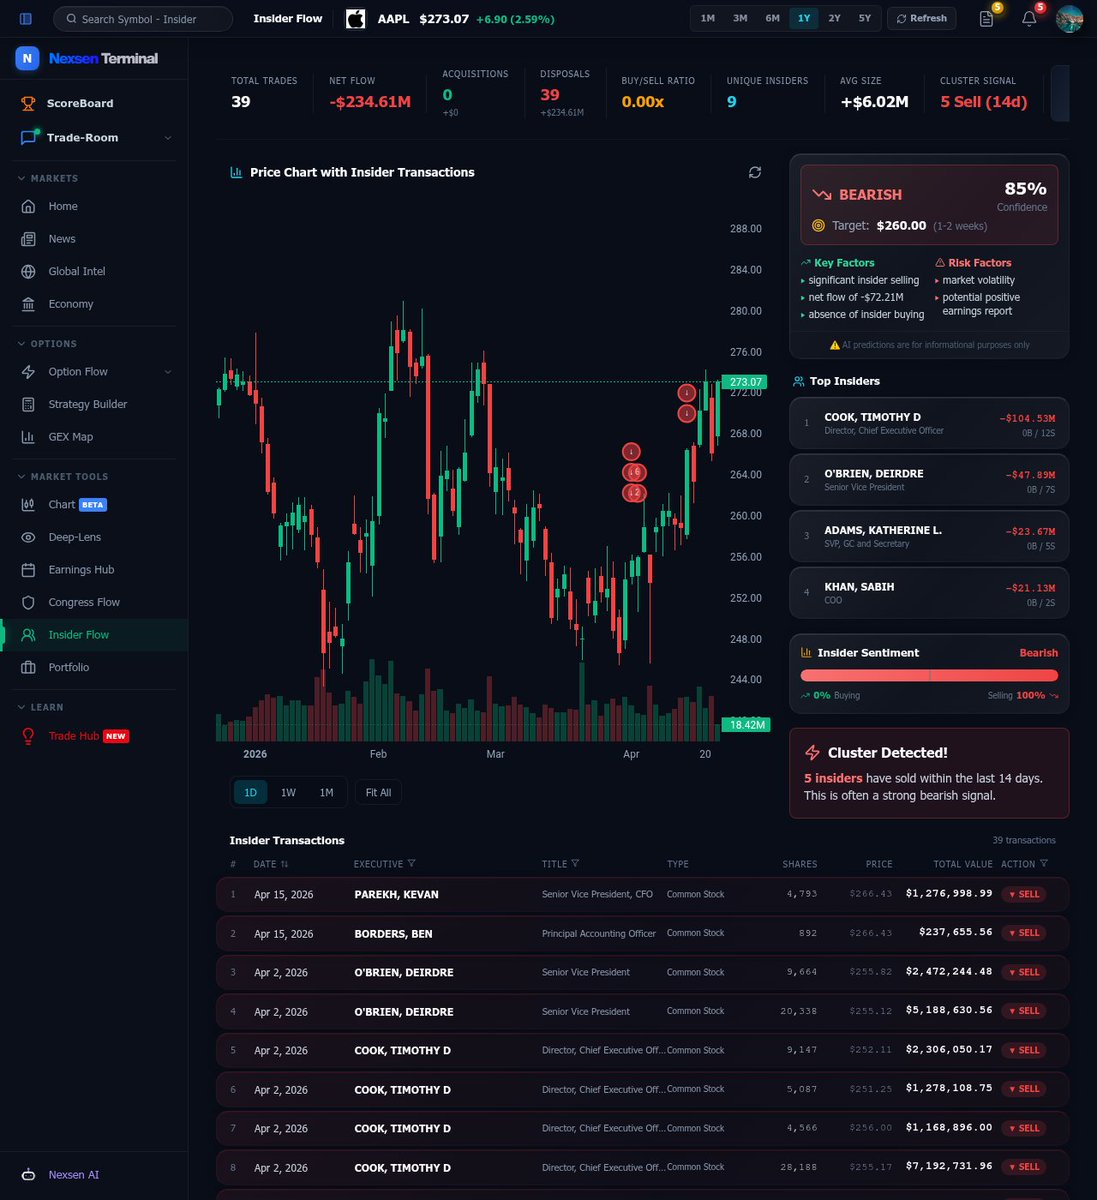
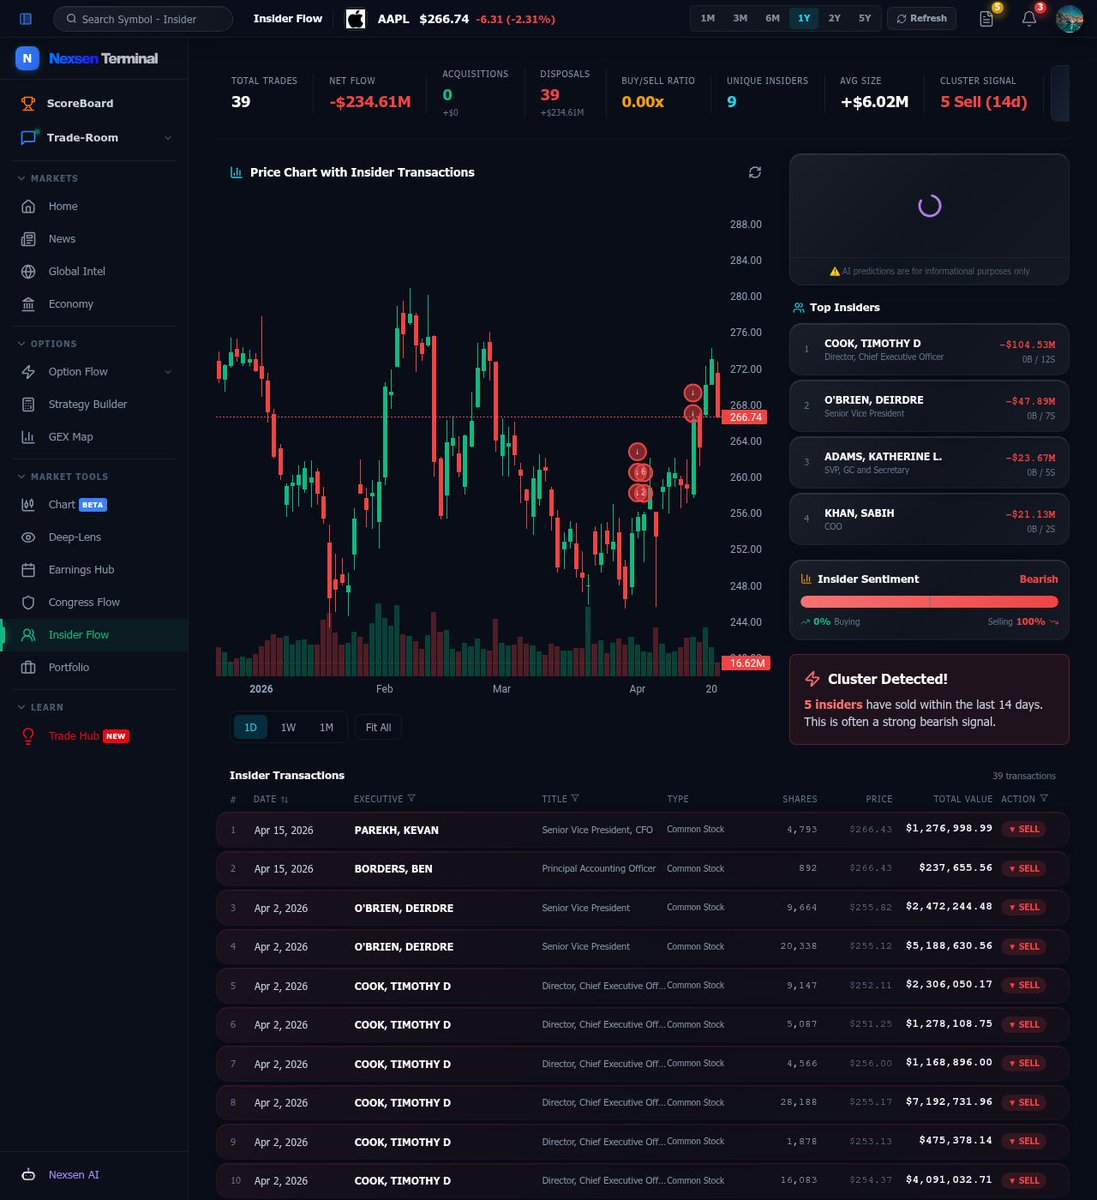
$QQQ insiders are screaming sell and the data is ugly. 5 insiders dumped shares in the last 14 days triggering a cluster signal, which historically precedes further downside. Net flow shows -$234.61M with zero acquisitions against 39 disposals. Top executives including the CEO sold over $104M combined. The sentiment gauge sits at 100% selling with a bearish target of $260 within 2 weeks, down from current $273. When C-suite exits in clusters during market volatility with no insider buying to offset, it's a red flag for positioning. This kind of concentrated distribution often precedes repricing events that catch retail off guard. https://t.co/c1Z1BMlJwQ #insiderflow #QQQ
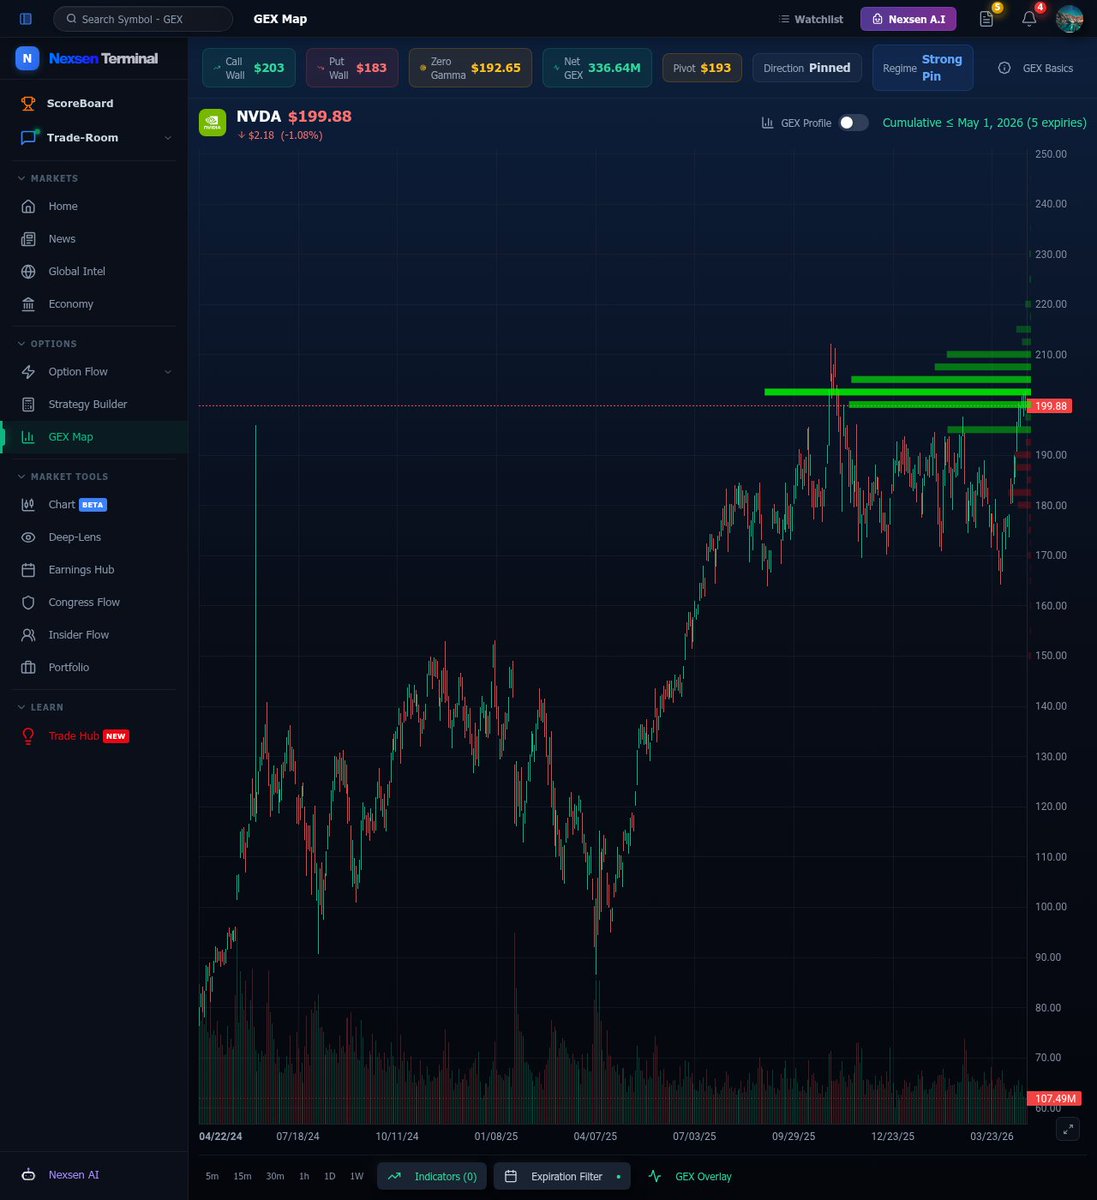
$NVDA showing critical GEX positioning into May 1st expiration with 5 expiries stacked. current price at $199.88 sitting right under a massive gamma wall between $200-210. this is textbook resistance from call hedging creating a ceiling that's been capping price action recently. what matters here: when GEX builds up like this above current price, it acts as a magnet but also a barrier. dealers hedge by selling into rallies as we approach these strikes, creating natural resistance. the heavier green bars show where the real gamma concentration sits—that's your battleground. the chart shows repeated tests of this zone with rejections, which makes sense given the positioning. if we break and hold above $210, the gamma flip could accelerate momentum as dealers shift from selling to buying. but until then, this overhead supply is real and documented in the options flow. this is why tracking GEX matters—it shows you where the friction points are before price gets there. not predictions,
nvda pinned at $202 with cumulative gex expiring apr 29. most traders are still reacting while smart money already positioned around this strike. the map shows exactly where the gamma sits.
https://t.co/W5FqpmG7Gb
#NVDA#GEX#OptionsTrading
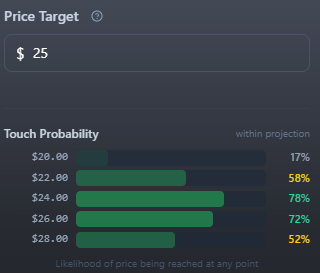
📊 Deep-Lens Update | $U (Unity Software)
On [April 04, 2026], our quantum projection model issued a price target of $25 on $U, assigning a 72% probability of completion within 20 sessions.
As of April 16, $U has exceeded that target — achieved in under 12 sessions.
Another validated projection by just one of our few tools inside https://t.co/u0SuEIqnUZ from the Deep-Lens engine.
@TradingBullsR@IncBulls
#Trading #Investing #DayTrading #SwingTrading #OptionsFlow #TechnicalAnalysis #StockAlerts
Our Deep-Lens tool uses quantum projection and a list of variables controlled by the user, has identifies ticker symbol $U (Unity) has a 72% change of hitting the projected $25 price target within 20 sessions.
The platform offers solutions to traders and investors who guess and doubt their trading plan, it offers them reassurance backed by data to make conviction in their trades. @IncBulls@TradingBullsR
https://t.co/u0SuEIqnUZ
$spy $qqq $ai $bitcoin $gold $oil
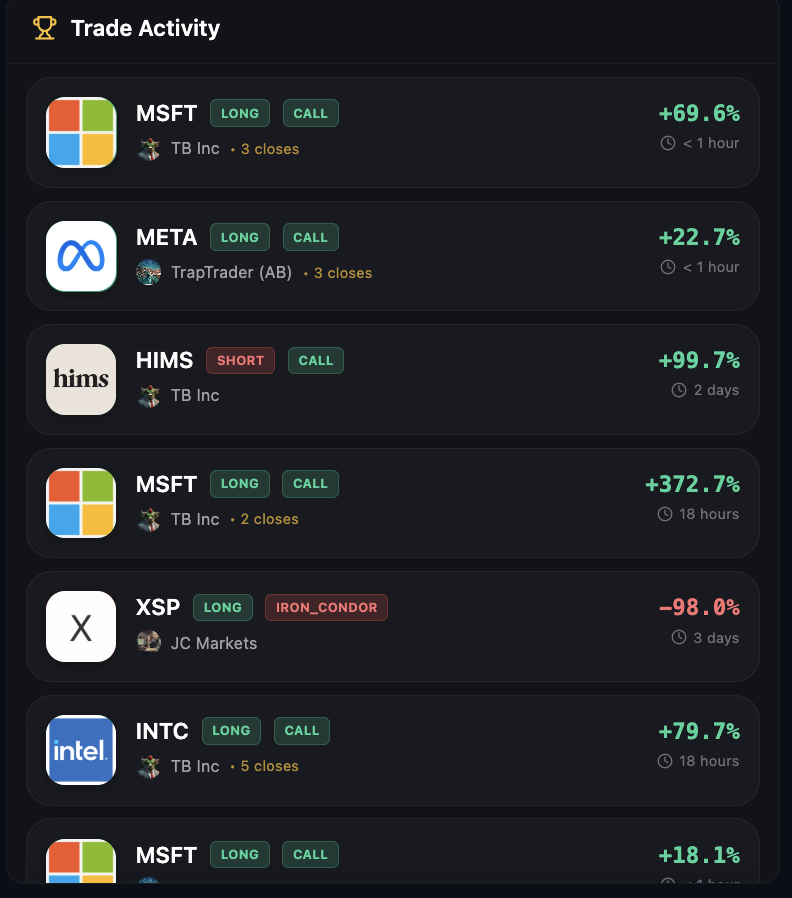
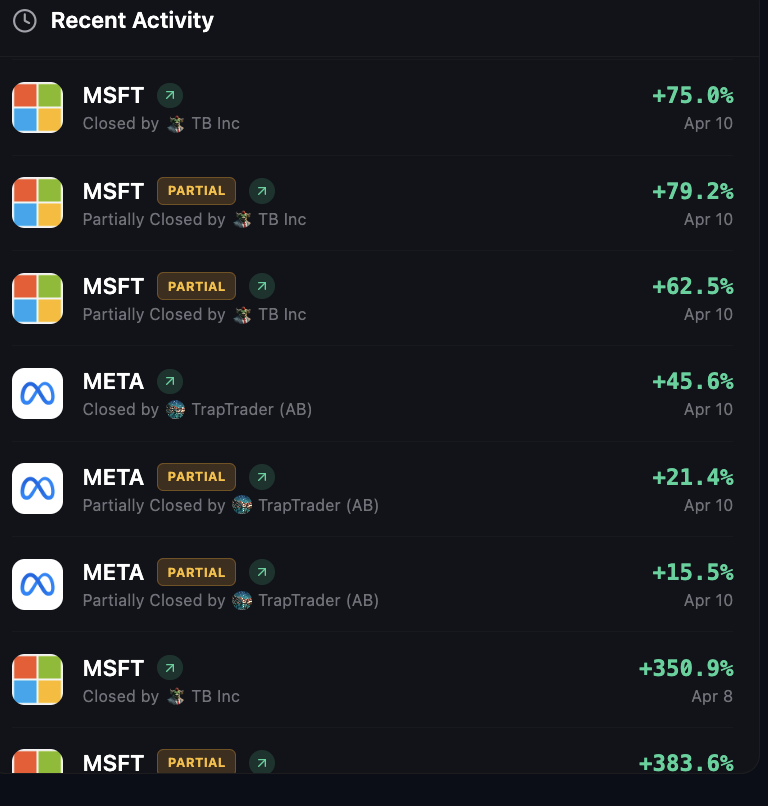
$MSFT and $META both presented high-conviction setups and every alert was delivered in real time through the chat. This is what NexsenTerminal was built for — closing the gap between retail and institutions.
https://t.co/lJ7lwvZD48
@IncBulls#SPY#QQQ#MSFT#options#investing
$SPY - Nexsen’s quantum projection tool - Deep-Lens DOES NOT EVER MISS!
Clearly posted the output from March 30 that a bounce to $655 was expected with a projection confidence of 86%.
Today $SPY again hit the $655 level.
You won’t find another projection tool, let alone a quantum powered one, with this level of accuracy.
https://t.co/d88EM3ADTS
📈 $SPY is sitting in a highly volatile gamma setup into next Friday’s expiration — which explains the wide intraday swings we’ve seen the past two sessions.
Today’s sharp rally off the lower open wasn’t random. In this type of environment, dealers are forced to buy strength and sell weakness. The opening move sets the tone — and once price started pushing higher at the open, that move got amplified as dealer hedging added fuel to the upside.
$SPX
nobody tells retail traders this but…
$AMD had a $10.3M dealer hedge sitting at $215 today
filtered April 2nd exp on the GEX map — market makers CANNOT let price move without hedging
so we knew exactly where price would gravitate
this is the edge institutions have. now you have it too
🔗 https://t.co/R3mIVi6mT1 | code: TRAPTRADER
@TradingBullsR@IncBulls
$spy $qqq $stocks $bitcoin
$institutionaldata $gex
Nexsen Terminal just dropped the Options Strategy Builder for every options trader tired of going in blind.
Pick your expiry, range your strikes, build out your full options setup, and stress test every outcome — delta, theta, breakevens, the works. All before you place the order.
Because the best trades are the ones you've already thought through.
https://t.co/d88EM3ADTS
.
.
.
Ex. shown: $50 Call expiring April 17 on $INTC
Yesterday in the chat room:
📍$MSFT — long bias to $370
📍GEX map on https://t.co/u0SuEIpQ5r flagged a $3.41M institutional hedge
📍Dealers forced to buy. Price followed.
This is what institutional flow looks like before the move. institutional
@IncBulls@TradingBullsR
$spy $qqq $gammaexposure $orderflow
🎯📈 Over the weekend, we dropped a full market analysis series inside Trade-Hub in Nexsen Terminal breaking this out step by step for users.
We went into how the selloff wasn’t as clean as it looked — under the surface, positioning was already shifting. Gamma profiles were setting up for support and order flow from Friday was leaning toward buyers stepping in.
The idea was simple: the drop was headline-driven… but the positioning didn’t confirm continuation.
Fast forward to today — market rips.
Not luck. Just reading what the data was already showing. The full breakdown + game plan was already sitting inside Nexsen before the move played out.
$SPY $RKLB $AMZN $META
https://t.co/Jn9u02L8oj
I used to trade earnings like everyone else.
pick a direction. buy the options. pray.
lost money more times than i care to admit.
then i started actually calculating the move cost before entering. checking whether the stock had a history of beating or missing. during which quarters where these companies the strongest, reading what CEO’s actually said on the calls.
that changed everything.
https://t.co/R3mIVi6mT1 built a tool that does all of this automatically — earnings calculator, beat/miss history, full transcripts, revenue breakdowns.
wish i had it years ago
@IncBulls@TradingBullsR
$spy $qqq $btc $earnings
Been messing around with the new dashboard on https://t.co/R3mIVi6mT1 and it's actually insane what it shows you
tracks your PNL obviously but also how long you're holding each trade, your win rate by month, how your performance trends over time — and then the AI just goes through everything and points out where you're losing edge.
Like it doesn't sugarcoat it. it'll tell you "you're consistently underperforming on friday afternoons" or "your average hold on losers is 4x longer than your winners"
Stuff you KNOW is probably happening but never actually look at.
@IncBulls@TradingBullsR
$spy $qqq $crypto $stocks $btc $ai


![ABajaj7's tweet photo. 📊 Deep-Lens Update | $U (Unity Software)
On [April 04, 2026], our quantum projection model issued a price target of $25 on $U, assigning a 72% probability of completion within 20 sessions.
As of April 16, $U has exceeded that target — achieved in under 12 sessions.
Another validated projection by just one of our few tools inside https://t.co/u0SuEIqnUZ from the Deep-Lens engine.
@TradingBullsR @IncBulls
#Trading #Investing #DayTrading #SwingTrading #OptionsFlow #TechnicalAnalysis #StockAlerts](https://pbs.twimg.com/media/HGE226aaYAAtV0z.jpg)


