We’re honored and thrilled that @MuseumModernArt has collected eight CryptoPunks through donations from @ArtOnBlockchain and his wife Mara, @CozomoMedici, @judithESSS, @kukulabanze, @NTmoney, and @Rhyd0n, along with two Punks of our own.
It’s genuinely surreal to see our work enter the collection of our hometown museum, and we’re grateful to MoMA for welcoming these works into their care.
Thank you to these members of the Punks community for their generosity and long-term belief in the work, and to @1OF1_art for their tireless effort in helping organize and steward this donation. Moments like this reflect the collective commitment that has carried CryptoPunks forward from the beginning.
A warm congratulations as well to @ArtOnBlockchain and the Chromie Squiggles collectors on their inclusion in the MoMA collection.
@BAYC1K One of the largest NFT creator said "I don't care about NFT floor price".
I will never touch those newly project that it create even the merch that they selling untill they care about the NFT floor price.
@SexyMichill 100%, the company is leading by an incompetent guy and team. The community is get smaller and smaller with a lot of hate toward the leadership.
Join me on Aave App to start earning 6.00% APY on your savings! Enter the referral code 85C533 during sign up to move up the waitlist. https://t.co/TNASUXpAql
The price of BTC hit a new all-time high last week.
Will it continue to rise or fall from the top?
Let's use 4 indicators to see if $BTC is at its peak now.
Rainbow Chart
https://t.co/L5rRD0Lvd9
The Rainbow Chart is a long-term valuation tool that uses a logarithmic growth curve to forecast the potential future price direction of $BTC.
The NEW Bitcoin Rainbow2023 Chart shows that you can still hold $BTC, and $BTC will top above $200K this cycle.
Relative Strength Index (RSI) Chart
https://t.co/vUML2gT3Vj
≥ 70: BTC is overbought and may soon fall. ≤ 30: BTC is oversold and may soon increase.
The current RSI is 71.35, compared with previous data, it seems that $BTC has not yet reached its peak.
200 Week Moving Average Heatmap
https://t.co/C5uuKsU7D9
The 200 Week Moving Average Heatmap shows that the current price point is blue, which means that the price top has not been reached yet, and it is time to hold and buy.
2-Year MA Multiplier
https://t.co/odkohvBIwG
The 2-Year MA Multiplier shows that the price of $BTC is in the middle of the red and green lines. It has not touched the red line and the market has not reached the top yet.
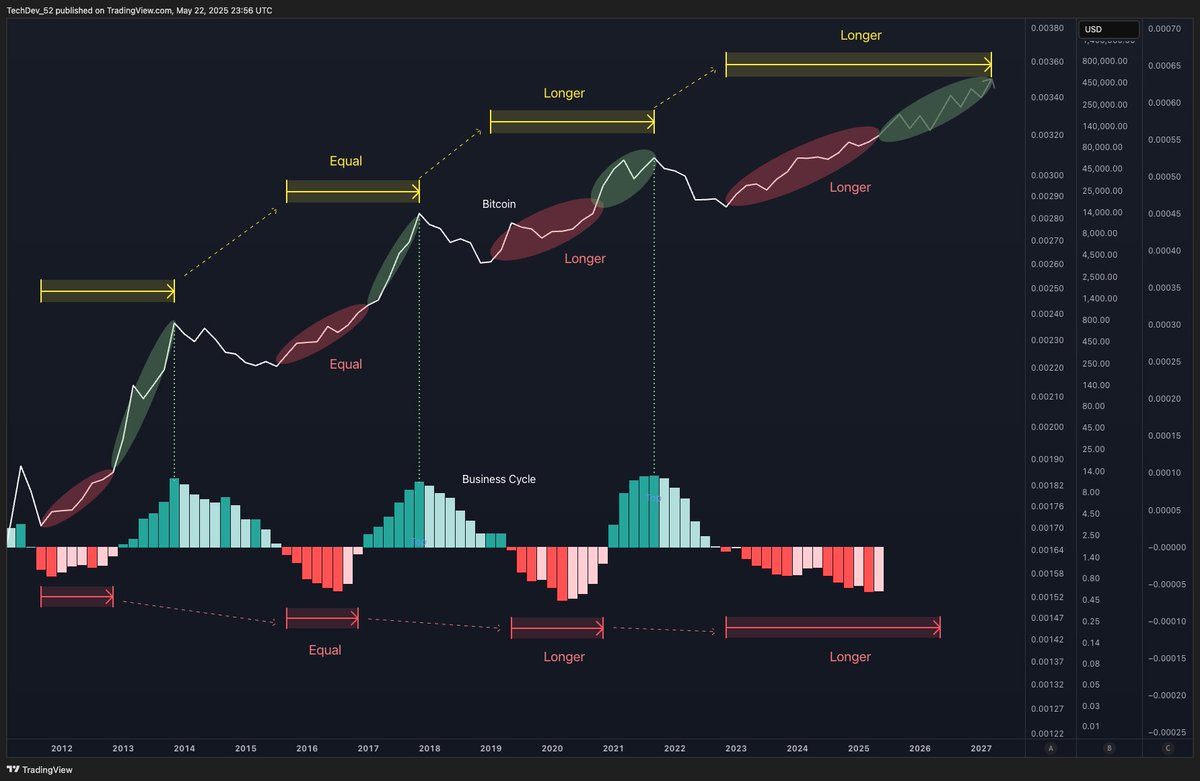
I've heard "one last push" for 2 years.
Maybe, just maybe, in an environment where everyone seems to think they can call the top...
What you get is a big grind up, farther and longer than most expect, or can stay solvent.
Interesting that the macro happens to support it.