Junior-level Data Analyst interview questions:
Introduction and Background
1. Can you tell me about your background and how you became interested in data analysis?
2. What do you know about our company/organization?
3. Why do you want to work as a data analyst?
Data Analysis and Interpretation
1. What is your experience with data analysis tools like Excel, SQL, or Tableau?
2. How would you approach analyzing a large dataset to identify trends and patterns?
3. Can you explain the concept of correlation versus causation?
4. How do you handle missing or incomplete data?
5. Can you walk me through a time when you had to interpret complex data results?
Technical Skills
1. Write a SQL query to extract data from a database.
2. How do you create a pivot table in Excel?
3. Can you explain the difference between a histogram and a box plot?
4. How do you perform data visualization using Tableau or Power BI?
5. Can you write a simple Python or R script to manipulate data?
Statistics and Math
1. What is the difference between mean, median, and mode?
2. Can you explain the concept of standard deviation and variance?
3. How do you calculate probability and confidence intervals?
4. Can you describe a time when you applied statistical concepts to a real-world problem?
5. How do you approach hypothesis testing?
Communication and Storytelling
1. Can you explain a complex data concept to a non-technical person?
2. How do you present data insights to stakeholders?
3. Can you walk me through a time when you had to communicate data results to a team?
4. How do you create effective data visualizations?
5. Can you tell a story using data?
Case Studies and Scenarios
1. You are given a dataset with customer purchase history. How would you analyze it to identify trends?
2. A company wants to increase sales. How would you use data to inform marketing strategies?
3. You notice a discrepancy in sales data. How would you investigate and resolve the issue?
4. Can you describe a time when you had to work with a stakeholder to understand their data needs?
5. How would you prioritize data projects with limited resources?
Behavioral Questions
1. Can you describe a time when you overcame a difficult data analysis challenge?
2. How do you handle tight deadlines and multiple projects?
3. Can you tell me about a project you worked on and your role in it?
4. How do you stay up-to-date with new data tools and technologies?
5. Can you describe a time when you received feedback on your data analysis work?
Final Questions
1. Do you have any questions about the company or role?
2. What do you think sets you apart from other candidates?
3. Can you summarize your experience and qualifications?
4. What are your long-term career goals?
Hope this helps you 😊
Just got to find out data analytics and data analysis are two different disciplines.
Data analysis deals more with analyzing a data set to get some insight and answer some specific questions.
Data analytics also include analyzing but it employs predictive modeling, etc..
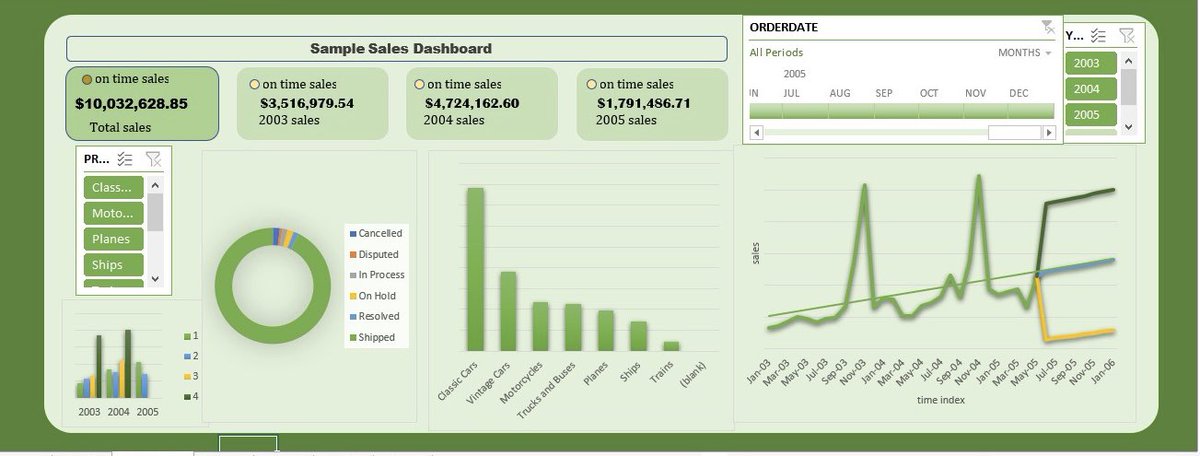
I underrated Microsoft Excel until I became a data analyst and saw the mind-blowing dashboards y'all were building with it.
If you don't mind, quote this with any of your Microsoft Excel project.
I really need the inspiration.
I've started learning Python. Actually started - not just planning to.
Week 1 covered:
1. Variables and data types
2. Strings, lists, dictionaries
3. Loops and conditionals
4. Functions
Some clicked. Some took three reads. That's fine.
Week 2 starts tomorrow.
#LearningInPublic
I've decided to learn Python.
Starting from scratch. No shortcuts.
I'll be sharing the journey what's clicking, what's confusing, all of it.
Already learning Python? What resource helped you most at the start?
Drop it below 👇
#Python#DataScience#LearningInPublic
Good news for the beginner Data Analysts here.
The WhatsApp learning group is now created.
This is for people who are serious about learning Data Analysis, especially Excel and the fundamentals.
Note: Serious-minded people only please
🔗 https://t.co/LORVwj6Os6
Day 10. We made it. 🎉
I organized this challenge. But the team made it worth it.
Every day someone showed up and pushed me to bring my best. That is what community does.
My 10 day summary:
1. Cleaned 16 years of Nigerian macroeconomic data
#30DaysBuildingInPublic
Biggest lesson:
Data analysis is not about tools. It is about asking the right questions and letting the data change your mind.
To everyone who finished the 10 days challenge put this on your CV. You earned it.
See you in the next challenge. 💪🏽
#DataAnalysis#DataScience
Day 8 of the 10 Day Data Challenge
Dashboard done & Peer Review complete. ✅
First, shoutout to my teammates. Went through their work today and they are doing a great job. This group pushes me every single day.
Now here is what I built.
⬇️⬇️⬇️
@DabereNnamani#DataAnalysis
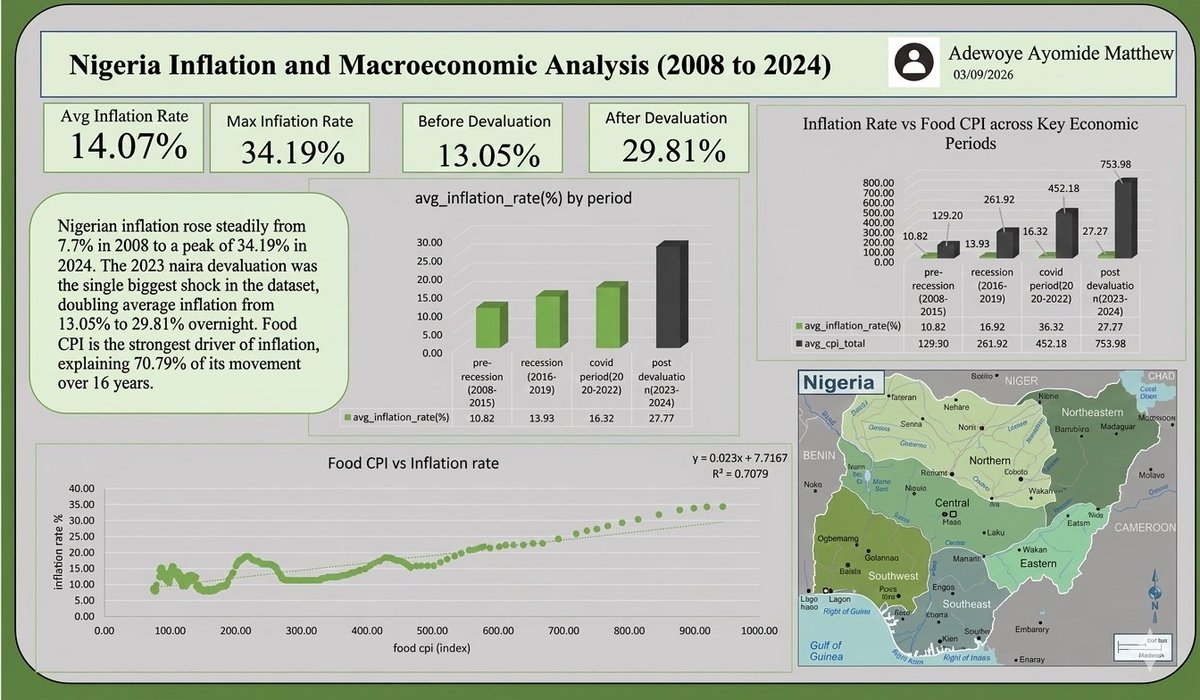
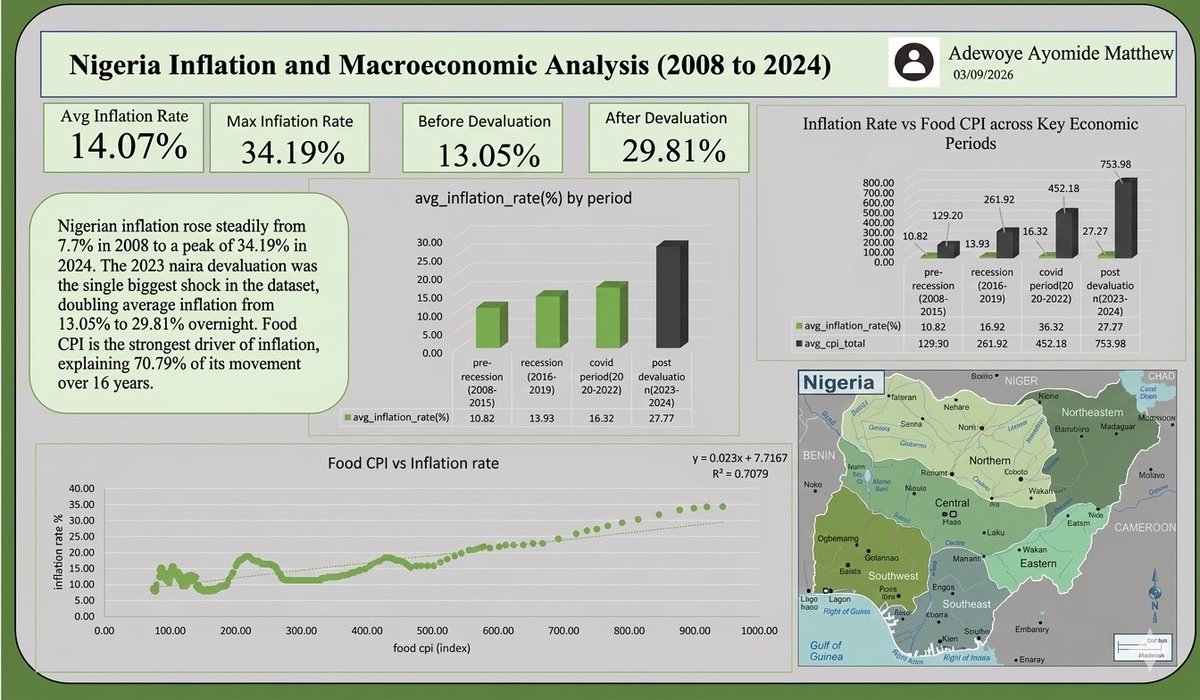
8 days of work. One page. One story.
Key metrics:
1. Avg Inflation: 14.07%
2. Max Inflation: 34.19%
3. Before devaluation: 13.05%
4. After devaluation: 29.81%
Biggest finding:
Food CPI explains 70.79% of Nigerian inflation over 16 years.