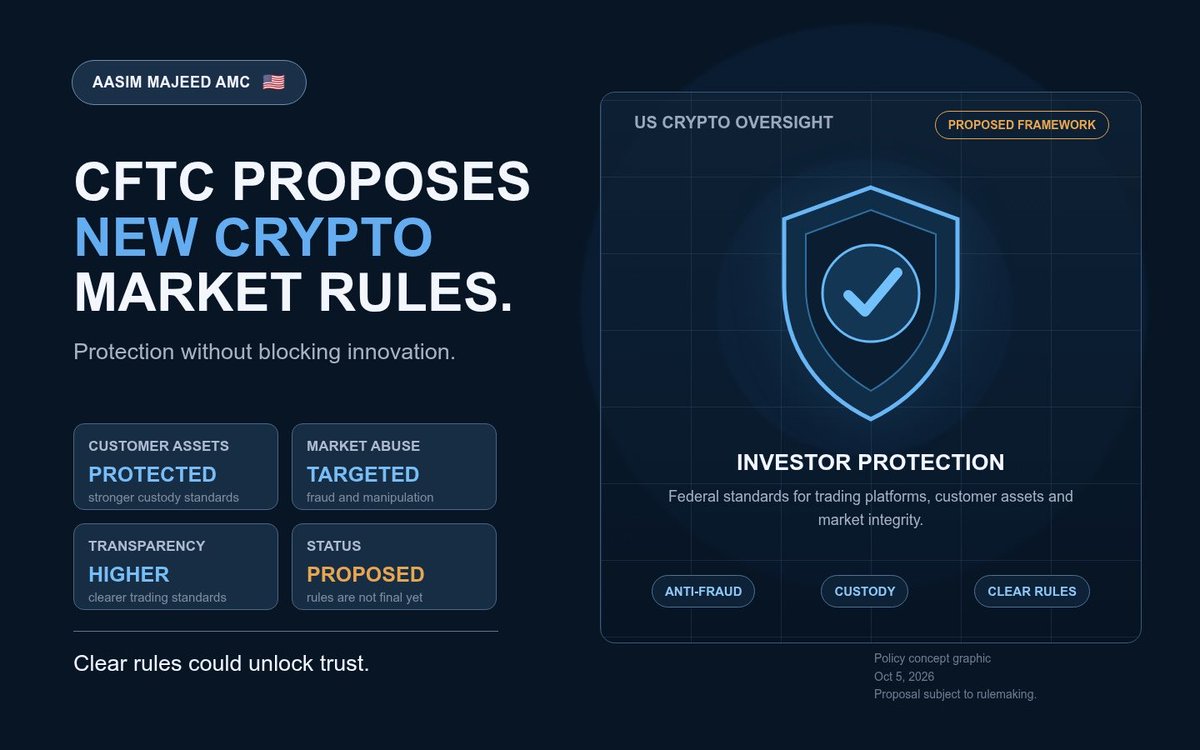
🚨 JUST IN: 🇺🇸 CFTC proposes new federal rules for crypto markets.
The framework would strengthen customer-asset protection, combat fraud and market manipulation, improve transparency, and give compliant crypto platforms clearer rules to operate in the United States.
This is not anti-crypto regulation—it is an attempt to bring crypto into the regulated US financial system.
⚡️ JUST IN: Brazilian Real rises nearly +5% against US Dollar after Flavio Bolsonaro beats Lula in Brazil’s first-round presidential election.
This marks Lula’s first presidential election loss since 1998. Brazilian markets are rising ahead of the October 25th runoff.
🚨 **OIL IS ABOVE $100—AND THE INFLATION TRADE IS BACK**
The biggest market risk today is not coming from stocks.
It is coming from energy.
Brent crude moved back above **$100 per barrel**, while WTI traded near **$92.80**.[^https://t.co/GBb55Tvt51]
The latest surge followed reports that the US is sending another aircraft carrier to the Middle East, increasing fears of a wider conflict and possible supply disruption.[^https://t.co/vpb0c5R69c]
At the same time, US–Iran negotiations remain stalled.
This matters far beyond the oil market.
Higher oil prices can raise:
Fuel costs
Transportation costs
Food prices
Business expenses
Inflation expectations
And if inflation expectations rise again, the Federal Reserve has less room to ease monetary policy.
That keeps pressure on:
Treasury bonds
Growth stocks
Housing
Small businesses
Consumer spending
Bitcoin and other risk assets
Brent gained around **14% in September**, its strongest monthly performance in years.[^https://t.co/uVnq97A3fW]
Now the key question is:
**Can oil remain above $100—or is this another geopolitical spike?**
Watch these markets closely:
Brent crude
WTI crude
Strait of Hormuz headlines
US 10Y Treasury yield
US Dollar
Airlines
Energy stocks
Nasdaq
If oil stays above $100, the market may have to price in stickier inflation and higher interest rates.
Stocks can ignore oil for one session.
The Federal Reserve cannot ignore it forever.
**Do not watch the oil price alone.**
Watch how bonds and inflation expectations react.
— Aasim Majeed AMC
#Oil #BrentCrude #Inflation #FederalReserve #US10Y #Markets #Stocks

🚨 ETHEREUM’S EXIT QUEUE HAS HIT A 2026 HIGH
The Ethereum validator exit queue has climbed to approximately **773,447 ETH**.
That is the highest level recorded in 2026.
The estimated waiting time has also increased to nearly **two weeks**.
This means a large number of validators are trying to exit Ethereum staking at the same time.
Why does this matter?
A rising exit queue can signal:
• Reduced confidence among stakers
• Increased demand for liquidity
• Possible profit-taking
• Future ETH supply becoming available
• Short-term pressure on market sentiment
But there is an important distinction:
ETH in the exit queue is not the same as ETH being sold immediately.
Ethereum’s protocol limits how quickly validators can exit, which spreads withdrawals over time.
The key question is what happens next.
If new staking deposits remain strong, the exit queue may eventually normalize.
If exits continue rising while entry demand weakens, more ETH could gradually return to liquid markets.
That could create additional selling pressure.
Watch these metrics closely:
ETH exit queue
ETH entry queue
Staking participation
Exchange balances
ETH/BTC ratio
Ethereum ETF flows
Validator activity
The exit queue is not an automatic sell signal.
But a sudden increase in unstaking demand is a clear sentiment warning.
Ethereum’s next major move may depend on whether new stakers absorb the exits—or whether more supply reaches the market.
— Aasim Majeed AMC
#Ethereum #ETH #Crypto #Staking #DeFi #Blockchain #Bitcoin
The supplied chart shows an exit queue of 773,447 ETH; ValidatorQueue data describes the queue as ETH waiting to leave Ethereum’s validator set, while The Block reported the same snapshot and value. [^https://t.co/taigOyqy6a] [^https://t.co/ZzfXj8WG6Z] [^https://t.co/MFqMeMgREx]
🚨 AI HAS BECOME THE MARKET
AI is no longer just a technology trade.
It is now influencing stocks, bonds, emerging markets and private capital.
The exposure is extraordinary:
• AI infrastructure companies represent 40% of the S&P 500’s market capitalization
• Just 3 chipmakers represent 28% of the MSCI Emerging Markets Index
• AI-related companies account for 49% of investment-grade bond issuance in 2026
• AI has captured 87% of venture capital funding year-to-date
For comparison, internet-related companies represented less than 40% of venture capital funding during the 1999 Dot-Com bubble.
This means the AI trade is now spread across multiple asset classes.
The opportunity is clear:
More infrastructure spending
Higher chip demand
Stronger data-center growth
Potential productivity gains
But the risk is also becoming larger.
If the AI cycle slows, investors may not be selling only technology stocks.
They may be selling:
• Equities
• Corporate bonds
• Emerging-market exposure
• Private-market investments
• AI infrastructure assets
The same theme is now embedded across the financial system.
That creates powerful momentum on the way up.
It can also create concentration risk on the way down.
The real question is not whether AI matters.
The real question is:
How much AI exposure does your portfolio already have without you realizing it?
Watch:
AI capex
Chip orders
Data-center demand
Power consumption
Corporate debt issuance
Credit spreads
Private-market valuations
AI has become the market.
That creates opportunity—but also vulnerability.
— Aasim Majeed AMC
#AI #Markets #Stocks #Bonds #Investing #Technology #Macro #ChipStocks
The figures are attributed in the supplied chart to Goldman Sachs, Apollo and Bloomberg; matching reports cite the same 40%, 49% and 87% exposure estimates. [^https://t.co/jHSWMZ0Dfo] [^https://t.co/vkgmf9m7xB]
🚨 US NFP JUST MISSED — LABOR MARKET IS COOLING
The September US jobs report came in much weaker than expected.
Nonfarm payrolls:
Actual: +29K
Expected: +84K–90K
Unemployment rate:
Actual: 4.2%
Expected: 4.1%
August payrolls were previously reported at +162K.
This is a significant slowdown in job creation.
The first market reaction may favor a dovish repricing:
Lower Treasury yields
Weaker US Dollar
Higher gold
Higher Bitcoin
Support for rate-sensitive tech stocks
But the setup is not completely straightforward.
Weak jobs data can increase expectations for easier monetary policy.
At the same time, a sharp slowdown can raise concerns about recession risk.
The Federal Reserve is now facing a difficult balance:
The labor market is losing momentum.
But inflation and commodity prices remain elevated.
That means weak NFP alone does not guarantee an immediate policy pivot.
Watch these markets closely:
2Y Treasury yield
10Y Treasury yield
US Dollar Index
Gold
Bitcoin
Nasdaq
Oil
The most important question now is not only how many jobs were created.
Markets will also watch:
• Wage growth
• Previous-month revisions
• Labor-force participation
• Fed rate expectations
Do not trade the headline blindly.
Watch the yield reaction.
If yields fall and the dollar weakens, gold and crypto may benefit.
If yields fall because recession fears rise, risk assets may struggle later.
— Aasim Majeed AMC
#NFP #JobsReport #Gold #Bitcoin #US10Y #FederalReserve #Markets
The official BLS report showed payroll growth of 29,000 and unemployment at 4.2%; market expectations were around 84,000–90,000 jobs and 4.1% unemployment. [^https://t.co/1WPBy3EeGW] [^https://t.co/7j5vfUlTj3]
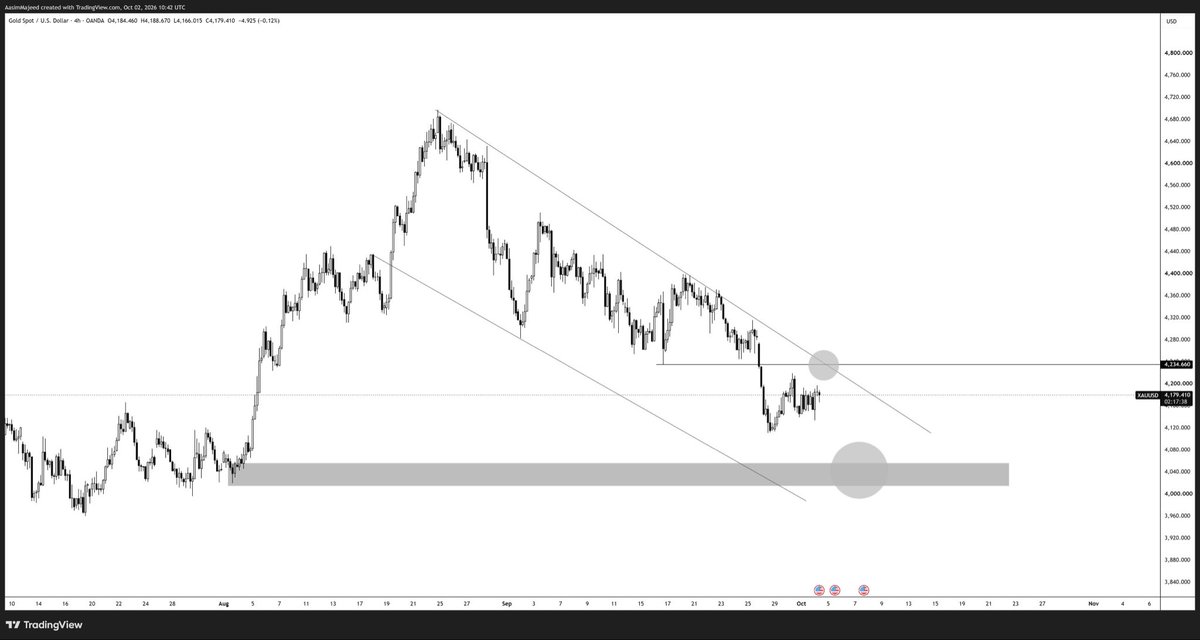
🚨 XAUUSD IS TRADING INSIDE A 4H DESCENDING CHANNEL
Gold is currently trading around $4,179 after facing rejection from higher levels.
The 4-hour chart shows a clear descending channel, with price still moving below the trendline resistance.
The key level to watch is around $4,234.
This area has acted as an important resistance level, and a clean 4H close above it could signal a change in short-term momentum.
Bullish scenario:
Gold reclaims $4,234 and breaks above the descending channel.
That could open the way toward the $4,280–$4,320 area.
Bearish scenario:
Price gets rejected below $4,234 and loses the recent support around $4,120.
That could expose the next major demand zone near $4,020–$4,060.
The current structure is still cautious.
Gold has strong long-term momentum, but the short-term chart remains under pressure until price breaks the channel.
Watch for:
• 4H close above $4,234
• Breakout from the descending channel
• Rejection near resistance
• Support around $4,120
• Demand zone near $4,020–$4,060
• US Dollar and Treasury yields
Do not chase the first candle.
Wait for confirmation from the level and the structure.
— Aasim Majeed AMC
#Gold #XAUUSD #TechnicalAnalysis #Trading #Commodities #Forex
*This is chart analysis, not financial advice.*
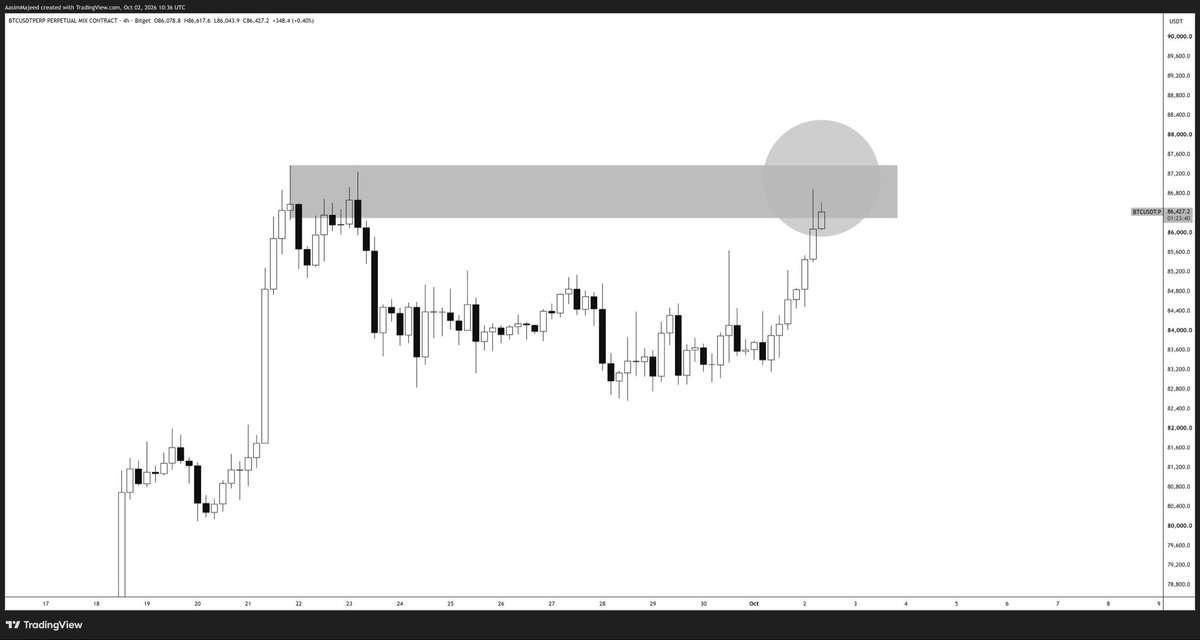
🚨 $BTC IS NOW TESTING A 4H SUPPLY ZONE
Bitcoin has rallied strongly from the $83K area and is now trading around $86.4K.
But price has reached a major 4-hour resistance and supply zone between roughly $86K and $87.3K.
This is where sellers previously stepped in.
That means the current area is not an ideal place to chase long positions.
The next move depends on how Bitcoin reacts here.
Bullish scenario:
BTC closes a 4H candle above the supply zone and successfully retests it as support.
That would confirm a breakout and could open the way toward the $88K–$90K area.
Bearish scenario:
Price gets rejected from the zone and loses the $86K area.
That could trigger a pullback toward the previous consolidation zone around $84K–$84.8K.
The chart is showing strong momentum—but momentum alone is not confirmation.
Watch for:
• 4H candle close
• Volume during the breakout
• Retest of the supply zone
• Rejection wick from $86K–$87.3K
• BTC dominance and market liquidity
The key question is simple:
Will BTC break through the supply—or become liquidity for sellers?
Do not chase the first breakout candle.
Wait for confirmation.
— Aasim Majeed AMC
#Bitcoin #BTC #Crypto #TechnicalAnalysis #Trading #SupplyAndDemand
*This is chart analysis, not financial advice.*
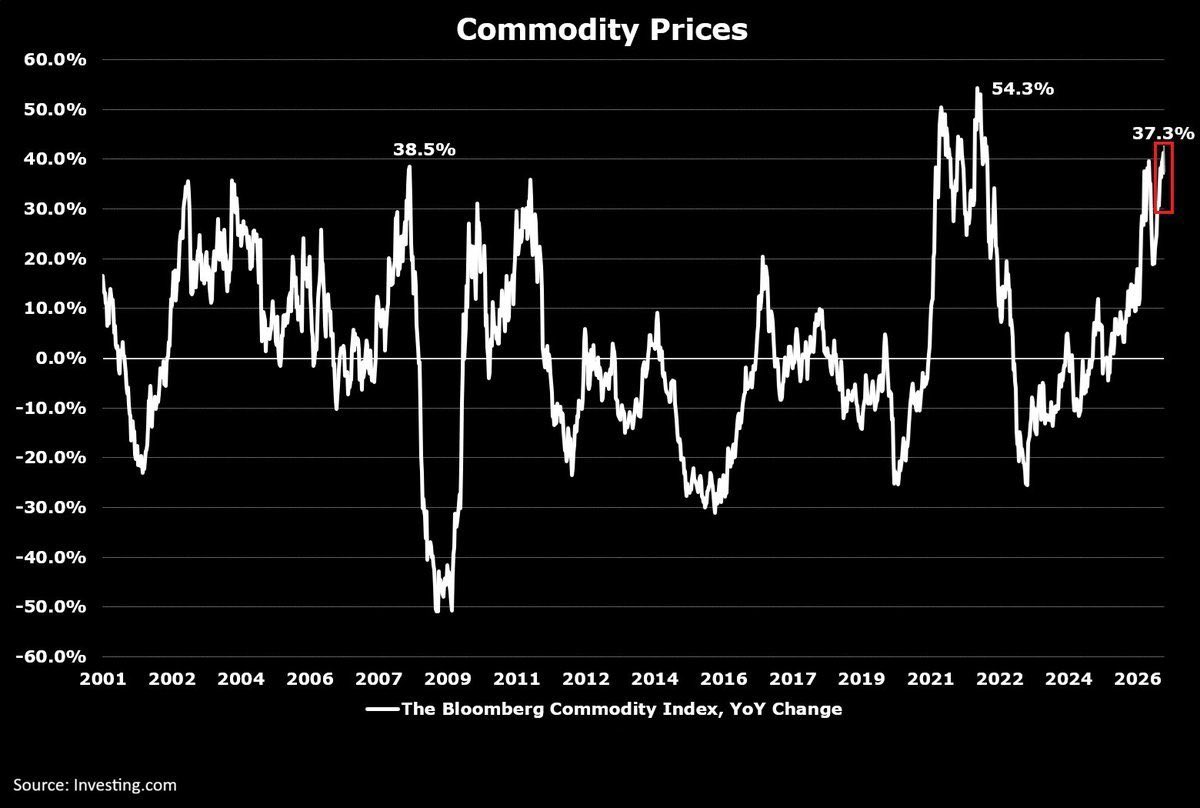
🚨 COMMODITY INFLATION IS MAKING A POWERFUL COMEBACK
Commodity prices are not just rising.
They are accelerating.
The Bloomberg Commodity Index is up:
+37.3% year over year
+32% year to date
That puts it near its largest 12-month increase since the 2022 energy crisis—and above the pre-2008 financial crisis run-up.
The Bloomberg Commodity Subindex is up an even stronger:
+44.9% year over year
Its biggest 12-month increase since 2022.
This index tracks 25 exchange-traded futures across:
Energy
Metals
Agriculture
This is not only an oil story.
It is a broad commodity inflation story.
When commodities rise together:
• Input costs increase
• Producer-price pressure returns
• Consumer purchasing power weakens
• Corporate margins come under pressure
• Inflation expectations rise
• Bond yields may move higher
• Rate-cut expectations can be delayed
The biggest risk is not simply higher commodity prices.
The bigger risk is a stagflation-style environment:
Slower growth.
Higher inflation.
Less room for central banks to cut rates.
That combination can create pressure across bonds, equities, currencies and crypto.
Watch these markets closely:
Oil
Copper
Gold
Agricultural commodities
10Y Treasury yield
Inflation breakevens
US Dollar
Nasdaq
Commodity inflation is back on the macro radar.
Do not treat this rally as an isolated commodity trade.
It may be one of the most important signals for the entire global market.
— Aasim Majeed AMC
#Commodities #Inflation #Oil #Gold #Markets #Bonds #Macro #Bitcoin
🚨 **THE LABOR MARKET IS STILL TOO STRONG FOR BONDS**
Yesterday, markets celebrated cooler inflation.
Today, the bond market received another warning.
US initial jobless claims came in at just **197,000**—below the **200,000 forecast** and close to multi-decade lows.[^https://t.co/e22Bzcmjz0]
That changes the market conversation.
Low claims mean companies are still reluctant to cut workers.
A resilient labor market gives the Federal Reserve less urgency to ease monetary policy—even after softer PCE inflation.
The bond market is reacting:
**US 10Y Treasury yield: around 5.31%**
**30Y yield: near multi-decade highs**[^https://t.co/CNtG9QBiLB]
This is the tension investors cannot ignore:
Cooler inflation supports risk assets.
But strong employment, expensive oil and rising government borrowing costs support higher yields.
That combination can become dangerous for:
Nasdaq
Growth stocks
Small caps
Housing
Bitcoin
Long-duration bonds
The key question is no longer whether inflation is cooling.
The real question is:
**Is the economy strong enough to keep interest rates higher for longer?**
Watch these markets closely:
US 10Y Treasury yield
US 30Y Treasury yield
US Dollar
Brent crude
Nasdaq
Bitcoin
Gold
If yields continue climbing, the relief rally may struggle to hold.
Soft inflation gave markets hope.
Strong labor data just reminded investors that the Fed may not be finished.
**Do not watch stocks alone.**
Watch the bond market—it is still setting the price of risk.
— Aasim Majeed AMC
#Markets #FederalReserve #US10Y #Bonds #Nasdaq #Bitcoin #Gold
**Research note:** Figures are based on the latest <date start="2026-10-01" /> releases and market snapshots. Prices may move during the session. Initial claims were 197,000, while Reuters reported layoffs near historically low levels.[^https://t.co/duJYHJ6PvX]
🚨 OIL IS NOW MOVING WITH TREASURY YIELDS — AND THAT IS A BIG WARNING
The positive correlation between oil prices and US government bond yields has risen to a 36-year high, according to the Financial Times.
The chart tracks the 3-month rolling correlation between oil and the US 10-year Treasury yield.
Why does this matter?
When oil rises alongside bond yields, markets may interpret it as an inflation and supply shock—not simply stronger economic growth.
Higher oil prices can:
• Push inflation expectations higher
• Increase Treasury yields
• Reduce expectations for rate cuts
• Keep borrowing costs elevated
• Put pressure on stocks, tech and crypto
On September 15, US Treasury Secretary Scott Bessent said President Trump was to blame for rising oil prices when asked why 10-year Treasury yields were climbing so quickly.
The market message is becoming clear:
Oil is no longer just a commodity story.
It is becoming a bond-market story.
If energy prices remain elevated, long-duration assets could stay under pressure—even if economic data begins to weaken.
Watch these markets together:
Brent crude
WTI crude
10Y Treasury yield
30Y Treasury yield
Inflation expectations
US Dollar
Nasdaq
Bitcoin
Correlation does not prove causation.
But when the oil-bond relationship reaches a 36-year extreme, investors cannot afford to ignore it.
Do not watch stocks in isolation.
Watch oil and bonds together.
— Aasim Majeed AMC
#Oil #Bonds #Treasury #Inflation #Markets #Bitcoin
Research basis: Financial Times reported the 36-year correlation extreme, while market coverage has linked the oil surge with rising Treasury yields and inflation concerns. [^https://t.co/azgIOh3K2F] [^https://t.co/p2lbSmL9JH] [^https://t.co/1TfkeY8q4Z]
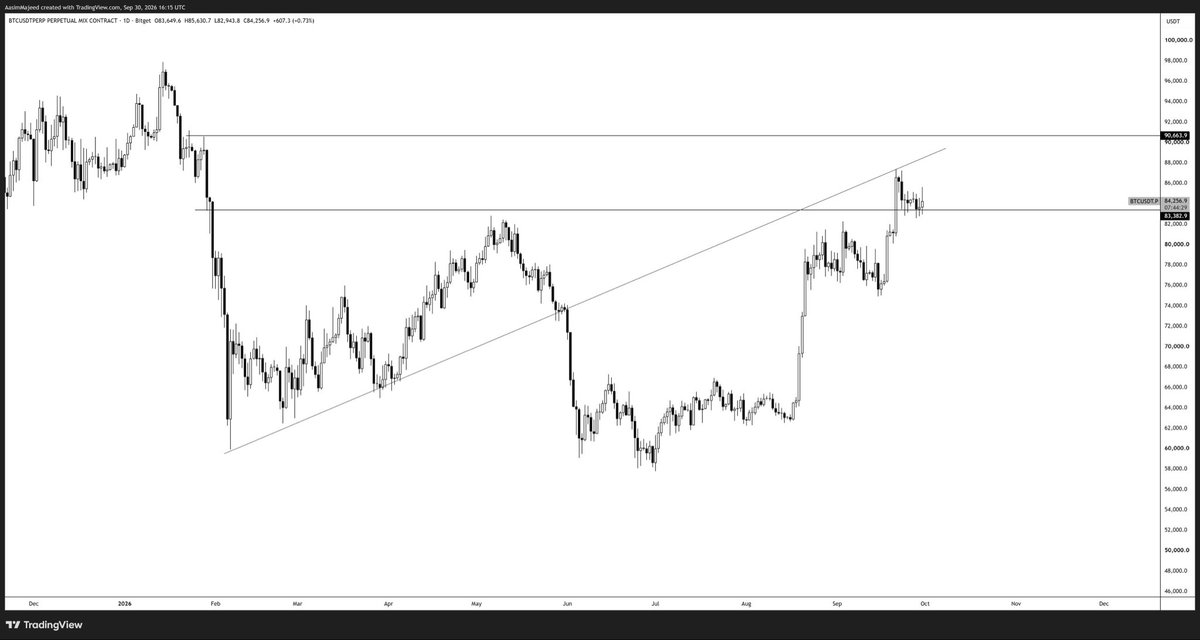
🚨 BITCOIN IS SITTING ON A KEY DECISION LEVEL
Bitcoin is trading around $84.2K after reclaiming the $83.3K area.
This level is now the key line in the sand.
As long as BTC holds above $83.3K, the short-term structure remains constructive.
A clean move above $86K could open the door toward the major resistance near $90.6K.
But the chart is not fully bullish yet.
Bitcoin is still trading below the major resistance zone, and the recent rally has already faced rejection from higher levels.
What the chart shows:
• Strong recovery from the $76K area
• Consolidation around $84K
• Immediate support near $83.3K
• Major resistance near $90.6K
• Buyers still need a confirmed breakout
Bullish scenario:
BTC holds $83.3K and breaks above $86K.
This could bring the $90.6K resistance back into focus.
Bearish scenario:
BTC loses $83.3K on a daily closing basis.
That would weaken momentum and increase the risk of a deeper pullback.
The next major move may be decided by the daily close—not the intraday wick.
Do not chase the candle.
Watch the level.
Structure first.
Emotions later.
— Aasim Majeed AMC
#Bitcoin #BTC #Crypto #TechnicalAnalysis #Trading
This is chart analysis, not financial advice.
🚨 COOLER INFLATION, BUT THE BOND MARKET IS NOT CONVINCED
The biggest story today is not just stocks bouncing.
The real question is whether this is a genuine relief rally—or just a temporary reaction to softer inflation data.
US PCE inflation came in below expectations:
Headline PCE: 3.4% YoY
Core PCE: 3.0% YoY
Both were cooler than economists expected.
Markets reacted positively:
Nasdaq: +0.92%
S&P 500: +0.53%
Dow Jones: +0.08%
But the bond market is still sending a warning.
The US 10Y Treasury yield remains around 5.24%.
Brent crude is near $99, while Bitcoin is trading around $83.3K and gold is near $4,178.
This creates a complicated market setup.
Cooler inflation supports hopes for easier monetary policy.
But elevated Treasury yields, strong energy prices and a firm US dollar are keeping financial conditions tight.
If oil remains elevated, inflation could become sticky again.
That means stocks can rally on soft data today—and still face pressure if yields move higher tomorrow.
Watch these markets closely:
10Y Treasury yield
30Y Treasury yield
Brent crude
US Dollar
Nasdaq
Bitcoin near the $82K–$83K zone
Gold
The inflation data is cooling.
But the risk premium is not.
Do not trade the headline alone.
Watch the yield reaction after the relief rally.
— Aasim Majeed AMC
#Markets #Inflation #US10Y #Nasdaq #Bitcoin #Gold
**Research note:** PCE data and market figures are based on the latest September 30, 2026 snapshots; prices can move during the session. [^https://t.co/cAw0p9lf0Q] [^https://t.co/SsbGd2L3Xj] [^https://t.co/CNtG9QBiLB] [^https://t.co/6lcYrkkePH] [^https://t.co/OWlpujBwx4] [^https://t.co/ZEKREz7CPI]
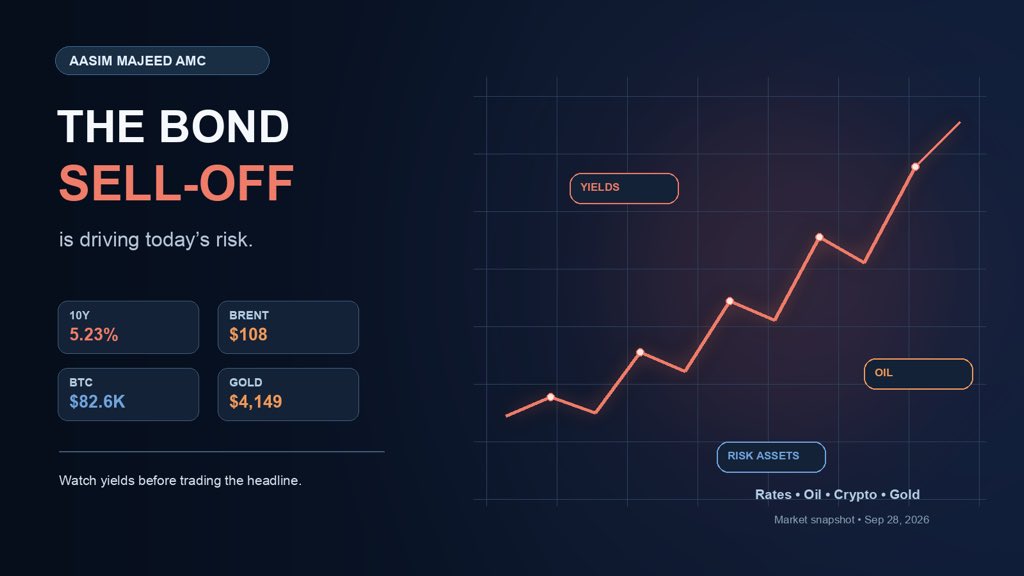
🚨 THE BOND MARKET IS DRIVING TODAY’S RISK
The biggest story today is not just stocks falling.
The bond market is sending the warning.
The US 10Y Treasury yield has climbed to 5.23%, while oil is trading near $108. At the same time, Bitcoin is around $82.6K and gold is near $4,149 in the latest market snapshot.
This is a cross-asset pressure event.
Higher yields make cash and bonds more attractive.
They also increase borrowing costs and put pressure on tech stocks, crypto and other risk assets.
Higher oil prices add more inflation pressure, which could delay expectations for easier monetary policy.
This is why markets may start moving in ways that feel unexpected.
Weak economic data may not automatically create a rally. If investors fear slower growth, they may continue selling risk assets even when yields fall.
Watch these markets closely:
10Y Treasury yield
Oil
US Dollar
Bitcoin
Gold
Nasdaq
The first market to confirm the next major move may be bonds, not stocks.
Do not trade the headline alone.
Watch the yield reaction.
— Aasim Majeed AMC
#Markets #US10Y #Bitcoin #Gold #Crypto
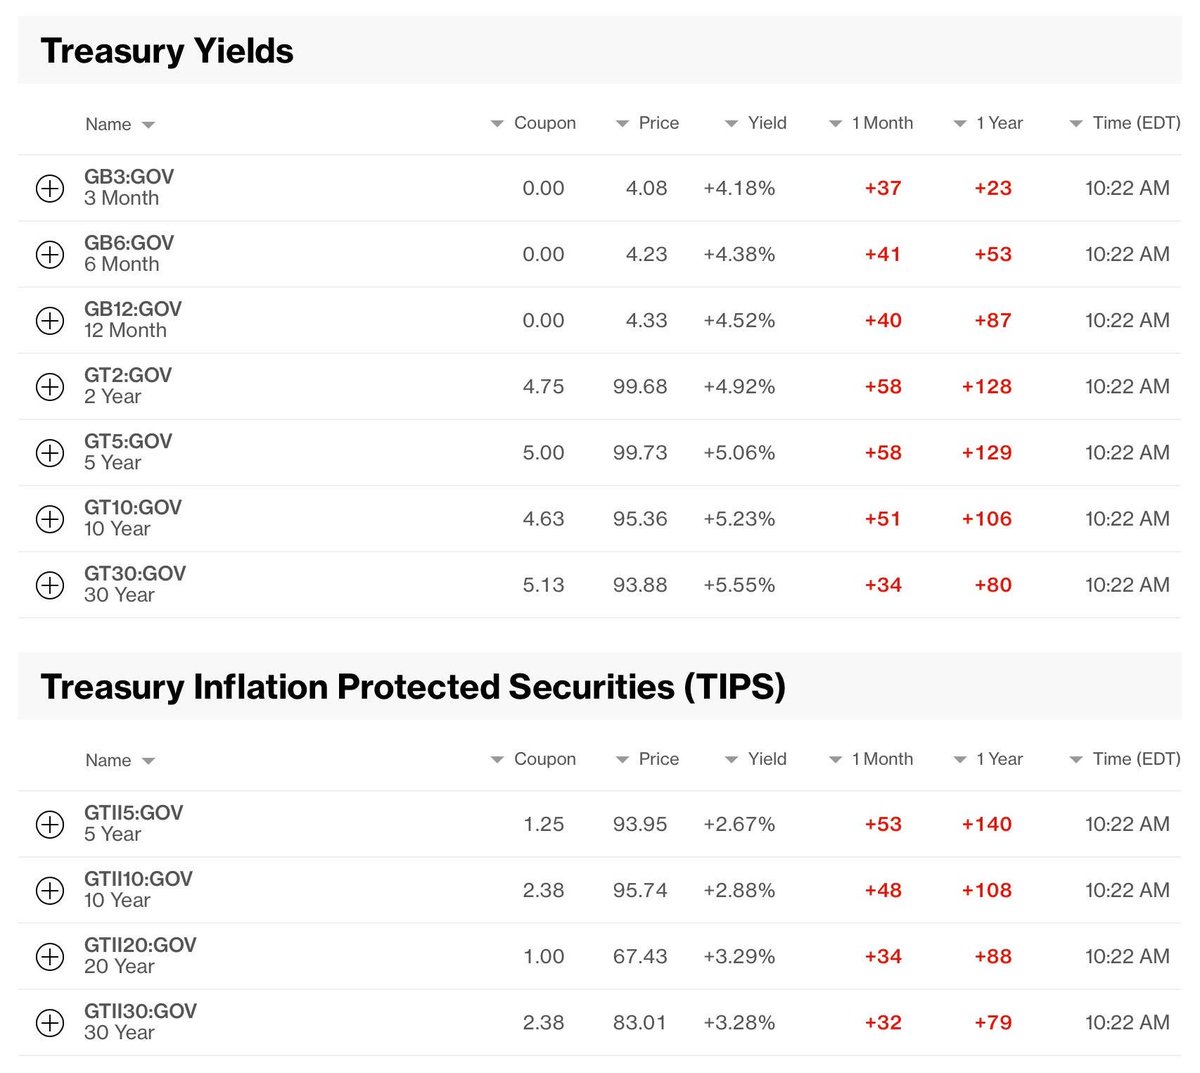
⏸ REAL YIELDS ARE NOW THE MARKET RISK
The latest market snapshot shows:
10Y Treasury yield: 5.23%
10Y TIPS real yield: 2.88%
Implied inflation breakeven: around 2.35%
This matters because the market is not only dealing with inflation expectations.
Real yields are also rising, and that increases the discount rate applied to almost every major asset.
This can create pressure on:
Stocks
Crypto
Real estate
Long-duration bonds
Gold, at least in the short term
Gold may not react immediately. It can lag while real yields rise and then move sharply once the market adjusts.
The US Dollar may also move differently from the usual Fed narrative.
That is why price action is more important than the story.
This week’s inflation and jobs data could create unusual market reactions.
A weak jobs report may not automatically send every asset higher. Watch Treasury yields first, then see whether the Dollar, Gold and crypto confirm the move.
Key levels to watch:
10Y yield near 5.23%
10Y TIPS near 2.88%
Real-yield direction
US Dollar reaction
Gold and Bitcoin response
Delayed reactions can quickly turn into aggressive intraday moves.
Do not trade the headline alone.
Watch the bond market first.
— Aasim Majeed AMC
#US10Y #TreasuryYields #Gold #Bitcoin #Markets






![AasimKhCrypto's tweet photo. 🚨 **OIL IS ABOVE $100—AND THE INFLATION TRADE IS BACK**
The biggest market risk today is not coming from stocks.
It is coming from energy.
Brent crude moved back above **$100 per barrel**, while WTI traded near **$92.80**.[^https://t.co/GBb55Tvt51]
The latest surge followed reports that the US is sending another aircraft carrier to the Middle East, increasing fears of a wider conflict and possible supply disruption.[^https://t.co/vpb0c5R69c]
At the same time, US–Iran negotiations remain stalled.
This matters far beyond the oil market.
Higher oil prices can raise:
Fuel costs
Transportation costs
Food prices
Business expenses
Inflation expectations
And if inflation expectations rise again, the Federal Reserve has less room to ease monetary policy.
That keeps pressure on:
Treasury bonds
Growth stocks
Housing
Small businesses
Consumer spending
Bitcoin and other risk assets
Brent gained around **14% in September**, its strongest monthly performance in years.[^https://t.co/uVnq97A3fW]
Now the key question is:
**Can oil remain above $100—or is this another geopolitical spike?**
Watch these markets closely:
Brent crude
WTI crude
Strait of Hormuz headlines
US 10Y Treasury yield
US Dollar
Airlines
Energy stocks
Nasdaq
If oil stays above $100, the market may have to price in stickier inflation and higher interest rates.
Stocks can ignore oil for one session.
The Federal Reserve cannot ignore it forever.
**Do not watch the oil price alone.**
Watch how bonds and inflation expectations react.
— Aasim Majeed AMC
#Oil #BrentCrude #Inflation #FederalReserve #US10Y #Markets #Stocks
](https://pbs.twimg.com/media/HTyFB41XMAAjsf9.jpg)
![AasimKhCrypto's tweet photo. 🚨 ETHEREUM’S EXIT QUEUE HAS HIT A 2026 HIGH
The Ethereum validator exit queue has climbed to approximately **773,447 ETH**.
That is the highest level recorded in 2026.
The estimated waiting time has also increased to nearly **two weeks**.
This means a large number of validators are trying to exit Ethereum staking at the same time.
Why does this matter?
A rising exit queue can signal:
• Reduced confidence among stakers
• Increased demand for liquidity
• Possible profit-taking
• Future ETH supply becoming available
• Short-term pressure on market sentiment
But there is an important distinction:
ETH in the exit queue is not the same as ETH being sold immediately.
Ethereum’s protocol limits how quickly validators can exit, which spreads withdrawals over time.
The key question is what happens next.
If new staking deposits remain strong, the exit queue may eventually normalize.
If exits continue rising while entry demand weakens, more ETH could gradually return to liquid markets.
That could create additional selling pressure.
Watch these metrics closely:
ETH exit queue
ETH entry queue
Staking participation
Exchange balances
ETH/BTC ratio
Ethereum ETF flows
Validator activity
The exit queue is not an automatic sell signal.
But a sudden increase in unstaking demand is a clear sentiment warning.
Ethereum’s next major move may depend on whether new stakers absorb the exits—or whether more supply reaches the market.
— Aasim Majeed AMC
#Ethereum #ETH #Crypto #Staking #DeFi #Blockchain #Bitcoin
The supplied chart shows an exit queue of 773,447 ETH; ValidatorQueue data describes the queue as ETH waiting to leave Ethereum’s validator set, while The Block reported the same snapshot and value. [^https://t.co/taigOyqy6a] [^https://t.co/ZzfXj8WG6Z] [^https://t.co/MFqMeMgREx]](https://pbs.twimg.com/media/HTtKe0IaQAA0lVx.jpg)
![AasimKhCrypto's tweet photo. 🚨 AI HAS BECOME THE MARKET
AI is no longer just a technology trade.
It is now influencing stocks, bonds, emerging markets and private capital.
The exposure is extraordinary:
• AI infrastructure companies represent 40% of the S&P 500’s market capitalization
• Just 3 chipmakers represent 28% of the MSCI Emerging Markets Index
• AI-related companies account for 49% of investment-grade bond issuance in 2026
• AI has captured 87% of venture capital funding year-to-date
For comparison, internet-related companies represented less than 40% of venture capital funding during the 1999 Dot-Com bubble.
This means the AI trade is now spread across multiple asset classes.
The opportunity is clear:
More infrastructure spending
Higher chip demand
Stronger data-center growth
Potential productivity gains
But the risk is also becoming larger.
If the AI cycle slows, investors may not be selling only technology stocks.
They may be selling:
• Equities
• Corporate bonds
• Emerging-market exposure
• Private-market investments
• AI infrastructure assets
The same theme is now embedded across the financial system.
That creates powerful momentum on the way up.
It can also create concentration risk on the way down.
The real question is not whether AI matters.
The real question is:
How much AI exposure does your portfolio already have without you realizing it?
Watch:
AI capex
Chip orders
Data-center demand
Power consumption
Corporate debt issuance
Credit spreads
Private-market valuations
AI has become the market.
That creates opportunity—but also vulnerability.
— Aasim Majeed AMC
#AI #Markets #Stocks #Bonds #Investing #Technology #Macro #ChipStocks
The figures are attributed in the supplied chart to Goldman Sachs, Apollo and Bloomberg; matching reports cite the same 40%, 49% and 87% exposure estimates. [^https://t.co/jHSWMZ0Dfo] [^https://t.co/vkgmf9m7xB]](https://pbs.twimg.com/media/HTpMbjbbEAAzjuJ.jpg)
![AasimKhCrypto's tweet photo. 🚨 US NFP JUST MISSED — LABOR MARKET IS COOLING
The September US jobs report came in much weaker than expected.
Nonfarm payrolls:
Actual: +29K
Expected: +84K–90K
Unemployment rate:
Actual: 4.2%
Expected: 4.1%
August payrolls were previously reported at +162K.
This is a significant slowdown in job creation.
The first market reaction may favor a dovish repricing:
Lower Treasury yields
Weaker US Dollar
Higher gold
Higher Bitcoin
Support for rate-sensitive tech stocks
But the setup is not completely straightforward.
Weak jobs data can increase expectations for easier monetary policy.
At the same time, a sharp slowdown can raise concerns about recession risk.
The Federal Reserve is now facing a difficult balance:
The labor market is losing momentum.
But inflation and commodity prices remain elevated.
That means weak NFP alone does not guarantee an immediate policy pivot.
Watch these markets closely:
2Y Treasury yield
10Y Treasury yield
US Dollar Index
Gold
Bitcoin
Nasdaq
Oil
The most important question now is not only how many jobs were created.
Markets will also watch:
• Wage growth
• Previous-month revisions
• Labor-force participation
• Fed rate expectations
Do not trade the headline blindly.
Watch the yield reaction.
If yields fall and the dollar weakens, gold and crypto may benefit.
If yields fall because recession fears rise, risk assets may struggle later.
— Aasim Majeed AMC
#NFP #JobsReport #Gold #Bitcoin #US10Y #FederalReserve #Markets
The official BLS report showed payroll growth of 29,000 and unemployment at 4.2%; market expectations were around 84,000–90,000 jobs and 4.1% unemployment. [^https://t.co/1WPBy3EeGW] [^https://t.co/7j5vfUlTj3]](https://pbs.twimg.com/media/HToFv4MbIAA347o.jpg)
![AasimKhCrypto's tweet photo. 🚨 **THE LABOR MARKET IS STILL TOO STRONG FOR BONDS**
Yesterday, markets celebrated cooler inflation.
Today, the bond market received another warning.
US initial jobless claims came in at just **197,000**—below the **200,000 forecast** and close to multi-decade lows.[^https://t.co/e22Bzcmjz0]
That changes the market conversation.
Low claims mean companies are still reluctant to cut workers.
A resilient labor market gives the Federal Reserve less urgency to ease monetary policy—even after softer PCE inflation.
The bond market is reacting:
**US 10Y Treasury yield: around 5.31%**
**30Y yield: near multi-decade highs**[^https://t.co/CNtG9QBiLB]
This is the tension investors cannot ignore:
Cooler inflation supports risk assets.
But strong employment, expensive oil and rising government borrowing costs support higher yields.
That combination can become dangerous for:
Nasdaq
Growth stocks
Small caps
Housing
Bitcoin
Long-duration bonds
The key question is no longer whether inflation is cooling.
The real question is:
**Is the economy strong enough to keep interest rates higher for longer?**
Watch these markets closely:
US 10Y Treasury yield
US 30Y Treasury yield
US Dollar
Brent crude
Nasdaq
Bitcoin
Gold
If yields continue climbing, the relief rally may struggle to hold.
Soft inflation gave markets hope.
Strong labor data just reminded investors that the Fed may not be finished.
**Do not watch stocks alone.**
Watch the bond market—it is still setting the price of risk.
— Aasim Majeed AMC
#Markets #FederalReserve #US10Y #Bonds #Nasdaq #Bitcoin #Gold
**Research note:** Figures are based on the latest <date start="2026-10-01" /> releases and market snapshots. Prices may move during the session. Initial claims were 197,000, while Reuters reported layoffs near historically low levels.[^https://t.co/duJYHJ6PvX]](https://pbs.twimg.com/media/HTjkdIZacAANDvE.jpg)
![AasimKhCrypto's tweet photo. 🚨 OIL IS NOW MOVING WITH TREASURY YIELDS — AND THAT IS A BIG WARNING
The positive correlation between oil prices and US government bond yields has risen to a 36-year high, according to the Financial Times.
The chart tracks the 3-month rolling correlation between oil and the US 10-year Treasury yield.
Why does this matter?
When oil rises alongside bond yields, markets may interpret it as an inflation and supply shock—not simply stronger economic growth.
Higher oil prices can:
• Push inflation expectations higher
• Increase Treasury yields
• Reduce expectations for rate cuts
• Keep borrowing costs elevated
• Put pressure on stocks, tech and crypto
On September 15, US Treasury Secretary Scott Bessent said President Trump was to blame for rising oil prices when asked why 10-year Treasury yields were climbing so quickly.
The market message is becoming clear:
Oil is no longer just a commodity story.
It is becoming a bond-market story.
If energy prices remain elevated, long-duration assets could stay under pressure—even if economic data begins to weaken.
Watch these markets together:
Brent crude
WTI crude
10Y Treasury yield
30Y Treasury yield
Inflation expectations
US Dollar
Nasdaq
Bitcoin
Correlation does not prove causation.
But when the oil-bond relationship reaches a 36-year extreme, investors cannot afford to ignore it.
Do not watch stocks in isolation.
Watch oil and bonds together.
— Aasim Majeed AMC
#Oil #Bonds #Treasury #Inflation #Markets #Bitcoin
Research basis: Financial Times reported the 36-year correlation extreme, while market coverage has linked the oil surge with rising Treasury yields and inflation concerns. [^https://t.co/azgIOh3K2F] [^https://t.co/p2lbSmL9JH] [^https://t.co/1TfkeY8q4Z]](https://pbs.twimg.com/media/HTf_9T5bYAArZJP.jpg)
![AasimKhCrypto's tweet photo. 🚨 COOLER INFLATION, BUT THE BOND MARKET IS NOT CONVINCED
The biggest story today is not just stocks bouncing.
The real question is whether this is a genuine relief rally—or just a temporary reaction to softer inflation data.
US PCE inflation came in below expectations:
Headline PCE: 3.4% YoY
Core PCE: 3.0% YoY
Both were cooler than economists expected.
Markets reacted positively:
Nasdaq: +0.92%
S&P 500: +0.53%
Dow Jones: +0.08%
But the bond market is still sending a warning.
The US 10Y Treasury yield remains around 5.24%.
Brent crude is near $99, while Bitcoin is trading around $83.3K and gold is near $4,178.
This creates a complicated market setup.
Cooler inflation supports hopes for easier monetary policy.
But elevated Treasury yields, strong energy prices and a firm US dollar are keeping financial conditions tight.
If oil remains elevated, inflation could become sticky again.
That means stocks can rally on soft data today—and still face pressure if yields move higher tomorrow.
Watch these markets closely:
10Y Treasury yield
30Y Treasury yield
Brent crude
US Dollar
Nasdaq
Bitcoin near the $82K–$83K zone
Gold
The inflation data is cooling.
But the risk premium is not.
Do not trade the headline alone.
Watch the yield reaction after the relief rally.
— Aasim Majeed AMC
#Markets #Inflation #US10Y #Nasdaq #Bitcoin #Gold
**Research note:** PCE data and market figures are based on the latest September 30, 2026 snapshots; prices can move during the session. [^https://t.co/cAw0p9lf0Q] [^https://t.co/SsbGd2L3Xj] [^https://t.co/CNtG9QBiLB] [^https://t.co/6lcYrkkePH] [^https://t.co/OWlpujBwx4] [^https://t.co/ZEKREz7CPI]](https://pbs.twimg.com/media/HTeg6GrbkAA-aLj.jpg)