Pharmaceutical Scientist by training, anything related to equities is my passion! Here to share and learn.
Nothing to be considered as investment advice !!
$NOW is getting hit hard after hours, what are the critical levels to watch?👇
ServiceNow is selling off sharply after hours 📉. Shares are down ~13%, with price falling back into the highlighted support area and moving closer again to the April 10 low at $81.25.
This matters because the recent bounce had started to improve momentum. Earnings has now interrupted that process before any real trend reversal could be confirmed.
▪️Immediate support: $89–91 zone
▪️Major support: April 10 low at $81.25
Is this an earnings overreaction that gets bought, or the start of a fresh breakdown?
$PLTR chart turning bullish again 📈
Bottomed near $126, built a solid base through Feb, reclaimed the 21D SMA and closed above the 50D SMA today at $155.
For the bulls, next real level to clear is $160–163 (VAH + 200D SMA). Push through that and the 100D SMA (~$167) is right above. 21D SMA below provides risk management level in proximity.
Does Palantir break the $160–163 zone next… or does it need more time around the 50D/POC first?
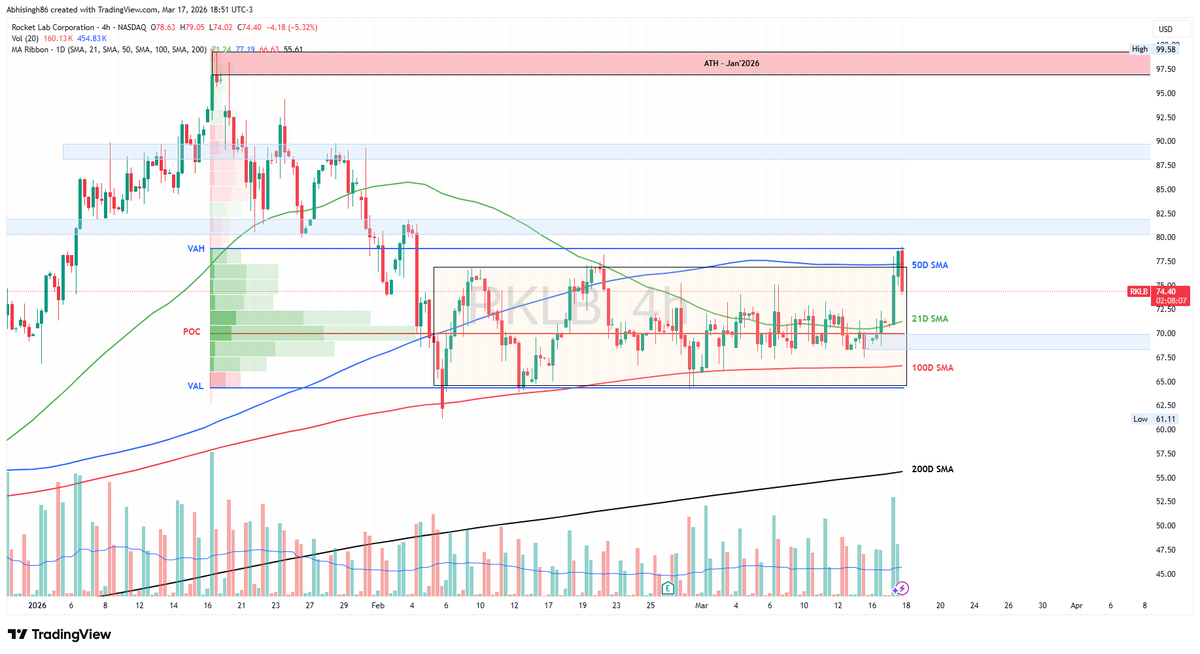
$RKLB chart still looks like repair / base-building, **not a clean uptrend… yet** 🚀
This one is definitely worth keeping on the watchlist!
After the Jan ATH selloff, RocketLab has spent weeks building a trading range: $65 VAL - $78 VAH.
Today price pushed into the top of that range + 50D SMA… but sellers rejected it hard. Not a confirmed breakout yet !!
For now, the key area is $70–71:
▪️Hold above = base intact
▪️ Lose it = rotation back to $67.5 → $65
Does $RKLB finally clear $78 on the next attempt, or will this range remain in control? Let us know 👇
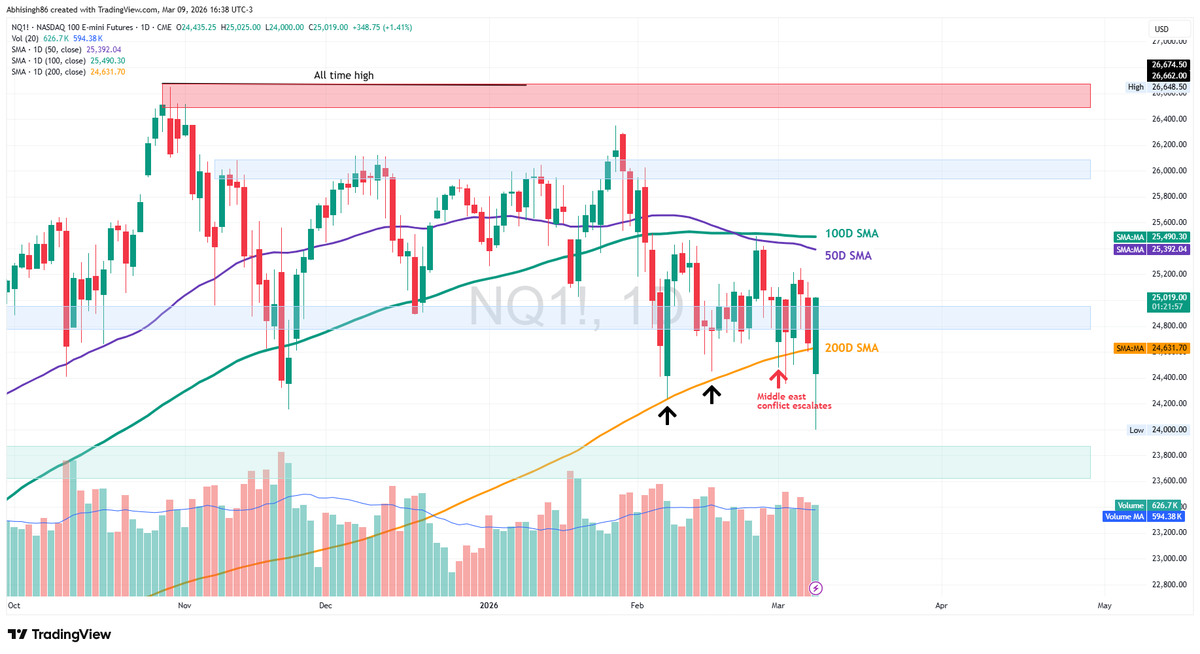
$NQ (Nasdaq 100 E-mini) is trading like a headline-driven market right now. Every escalation / de-escalation out of the Middle East is flipping risk appetite intraday, and that’s showing up on the chart as sharp wicks and fast reversals.
The one clean signal on the chart: the 200-day SMA. As we have stated before, that’s the line in the sand. We just flushed toward ~24,000 and bounced back above 200D. This is constructive, but still in repair mode with the 50D/100D overhead.
Will the 200D hold and we grind higher, or another flush incoming?
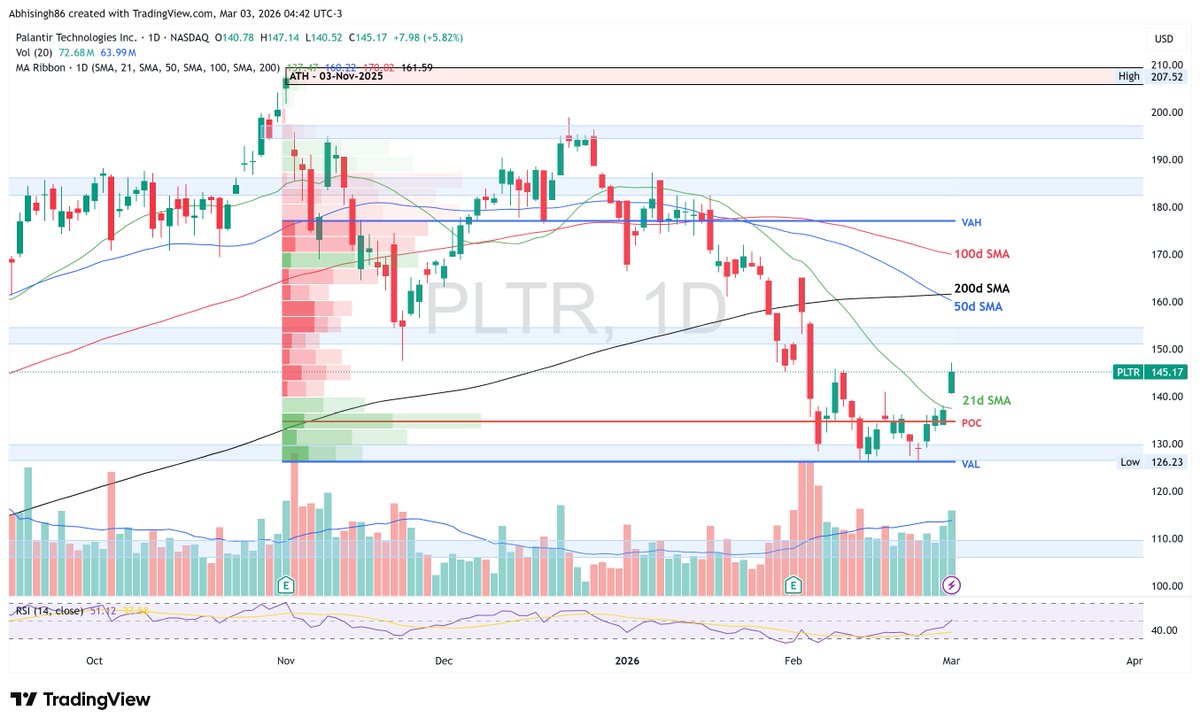
$PLTR follow-up: $126–136 HVN base did its job ✅
Now the chart is at the first major overhead resistance confluence since that reclaim: the 50D SMA (~$157) with the 200D SMA (~$162) just above.
➡️ A break and hold above the 50/200D opens a path toward the 100D (~$169), then VAH (~$178).
⬇️ A rejection here could push price back toward ~$135 (POC/21D) — the key “don’t lose it” level.
Do you think $PLTR clears the 200D, or fades back lower?
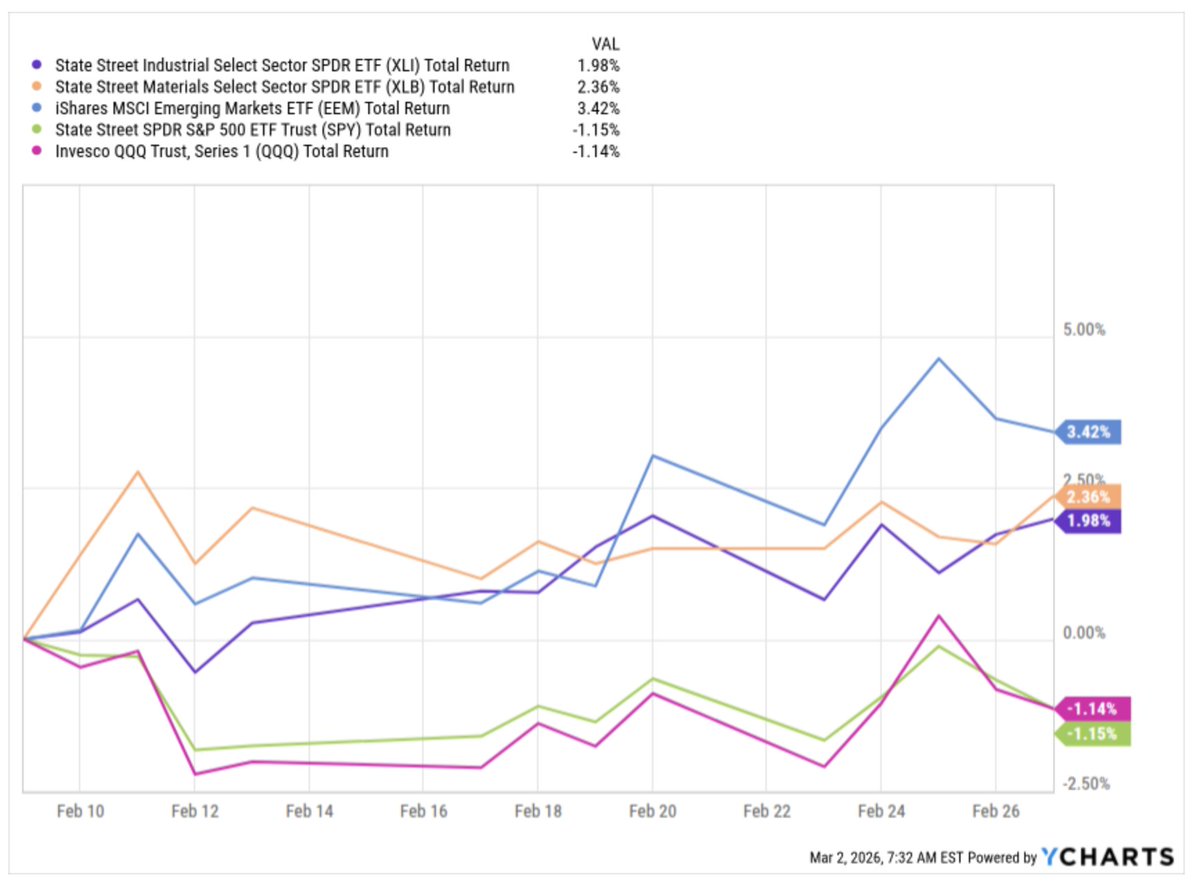
Our SignalFlow AI Sector Rotation algorithm last rotated its holdings at the close on 6 February. Here’s how it’s doing since then. It uses simple unlevered sector ETFs, no options, no leverage.
Will the latest Middle East escalation spark a broader market correction?
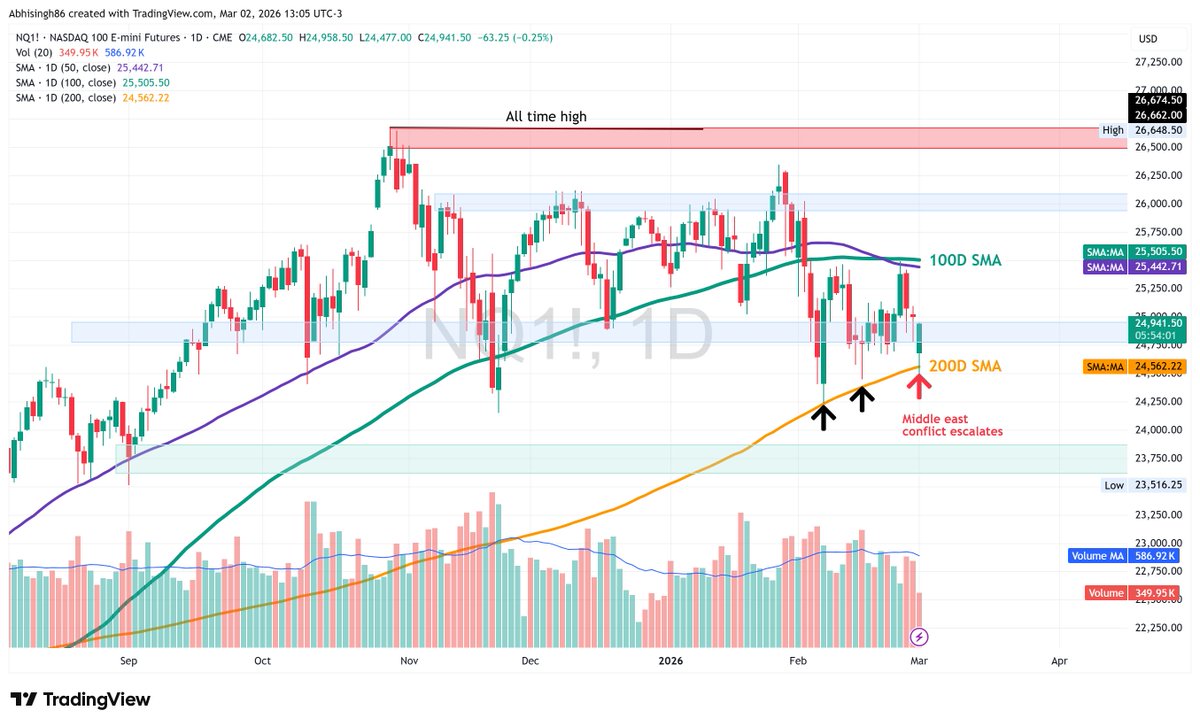
No one knows where $NQ (Nasdaq 100 E-mini) futures go next — but the chart is clear: the 200-day SMA has been tested and defended 3x since Feb 6. 📈
In this tape: Risk management > Predictions.
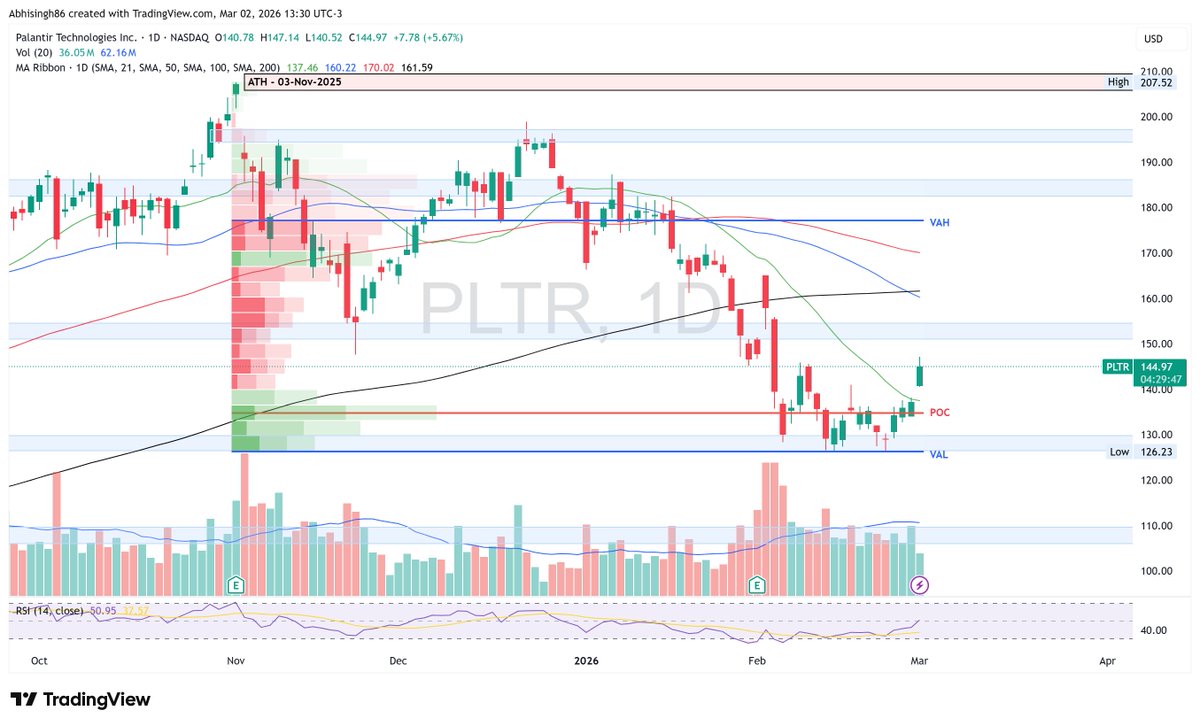
$PLTR (Palantir) follow-up: $126–136 HVN base is still doing its job.
Today’s +5.5% push reclaimed the FRVP POC (~$135) and popped back above the 21D SMA.
From here, the 21D SMA & FRVP POC are the key risk-management levels — lose them and price can fall back into the base.
If someone sat there over the weekend thinking, “middle-east situation worsening = risk-off equities and crypto, risk-on US bonds,” yesterday delivered the exact opposite.
Which just goes to show: watching the news / looking outside the window is a poor guide to what’s going to happen in securities prices.
One possible way is to be set up according to charts, algorithms, personal judgment on the securities as distinct from the real world and play them accordingly. 📊
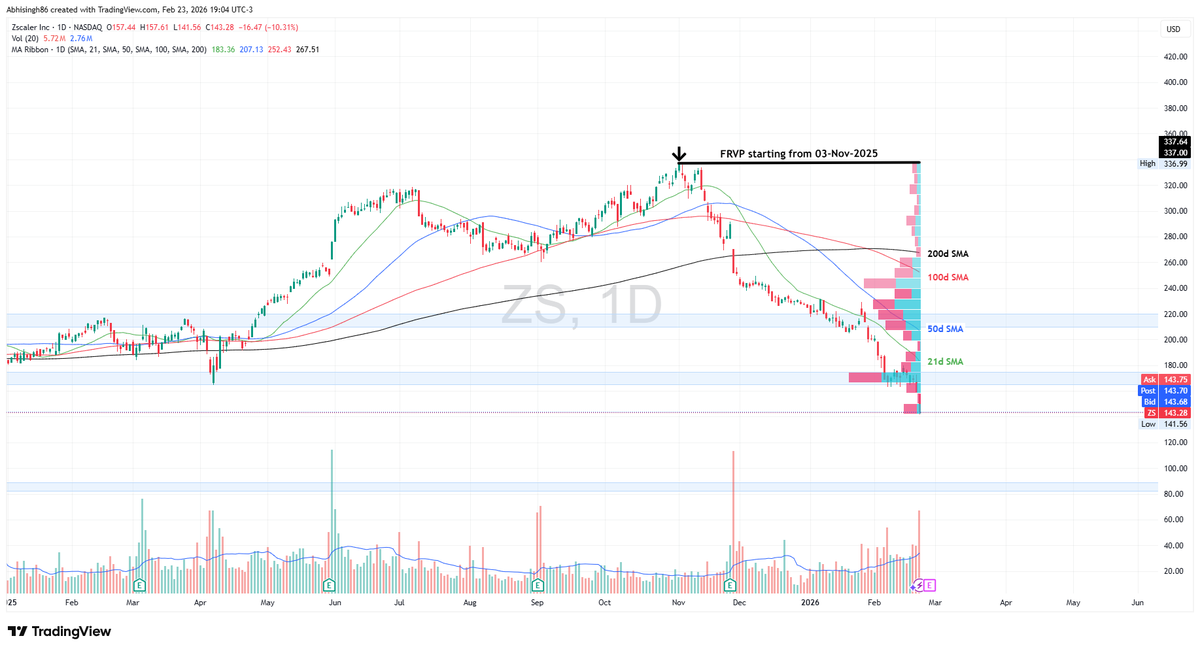
The tale of two charts: why $PLTR looks more constructive than $ZS?📊
On chart structure alone, Palantir looks more constructive than Zcalers right now. Here is our view:
1. SMA :
▪️ $PLTR has reclaimed the 21D SMA. $ZS is still below it.
▪️ $PLTR still has 100D > 200D — not great, but less damaged. $ZS has the 21/50/100D all below the 200D — classic broken-trend structure.
2. FRVP (anchored from the 03-Nov-25 high) :
▪️Buyers are dominating the HVN at the lows (possible base) for $PLTR, whereas sellers are dominating the HVN at the lows for $ZS.
▪️POC: $PLTR is above the FRVP POC → acceptance back into value. $ZS is below POC → still in repair mode.
3. RSI
▪️ $PLTR improving, $ZS remains depressed.
Price action appears to be more constructive for $PLTR vs $ZS.
$ZS needs to reclaim POC (~$168) at minimum before the picture changes.
In case anyone hasn't cottoned on to the game here - "Claude will send your stocks to 0" is the new "Tariffs will send your stocks to 0" which was the new "Recession will send your stocks to 0" which was the new "Covid will send your stocks to 0".
Ignore the narrative, better to keep your head free and clear. Just watch price and volume and use risk management.
In the current market environment, sentiment is weak across many single names — and that’s often when it can pay to watch for accumulation. But risk management still matters most. 📊
Case in point: our recent Zscaler ( $ZS ) chart setup below. A base around $170 looked possible, and the chart could still repair over time.
But once price lost the level 📉, a stop a little below the recent lows could have made sense. Without a stop, that base formation idea would be sitting in a >15% drawdown now.
Invalidation matters as much as the setup.
Do you keep stops tight in this environment, or give setups more room to breathe?
$NQ futures price action is under classic compression: lower highs / higher lows while volume is fading. Long-term SMAs are pointing up, but the 50D SMA is starting to flatten.
We are in an indecisive market regime — there’s no clear short-term trend.
Which way do you think the coil resolves?
$NQ futures: all-time highs in sight? 📈
As shown in the daily chart, price is pressing the 26,000 zone with EMAs converging below.
If the price breaks + holds above 26,000: I think we get an ATH retest (~26,648, ~+2.5%). 🚀
Rejection: the 8/21/34D EMAs + 50D SMA cloud is the first support band to watch. 📉
Do you think $NQ will revisit ATH — or will there be a pull back first?
Historically, US Government shutdowns are short-lived storms, disruptive but temporary.
The 2018-19 shutdown, the longest on record (5 weeks), shaved 10-15 bps off GDP per week according to the CBO.
But once the shutdown ended, the economy bounced right back.
Markets get this and often look past the noise.
During the last 3 shutdowns since 2010, the S&P gained 4.7% on average, even posting a 10.3% return during the 35-day 2019 shutdown. Bond yields dipped slightly, and the dollar usually softened.
(Table Source: RBC)