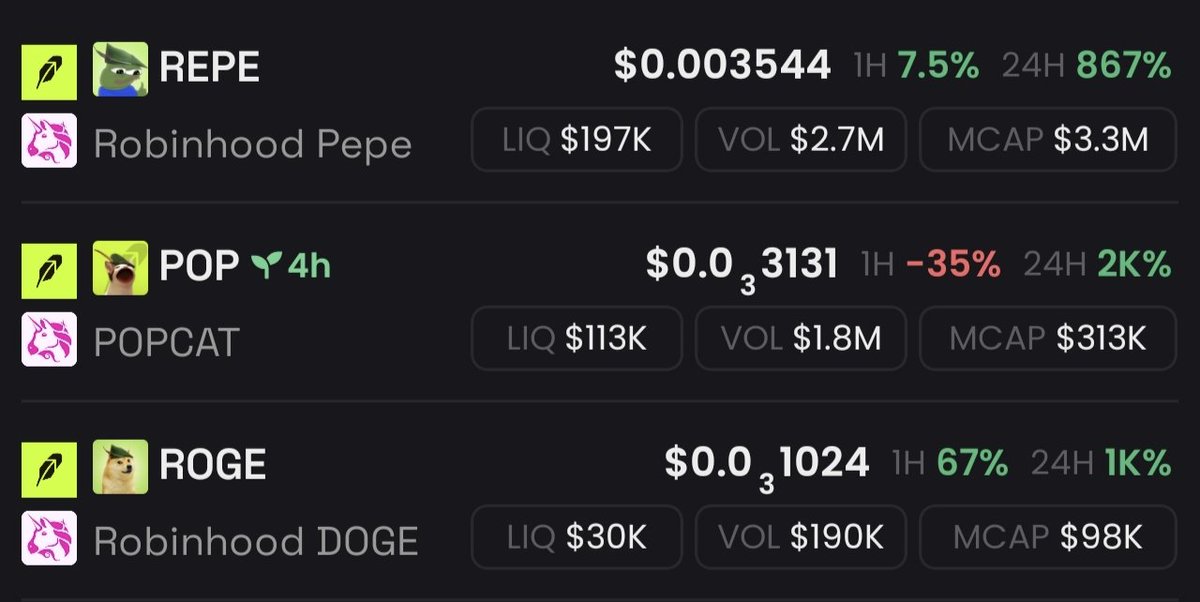
$98,000 Mcap is still very small compared to the currently bustling Robinhood chain. Especially since $CASHCAT has already set a new ATH. Send it to Vlad's favorite memecoin, $ROGE.
CA:
0x1634D684B56Dc4d3619FB4FB54C24471831969A7
$REPE #Cashcat
Daily Timeframe:
- RSI: In oversold territory (~30–35) after the sharp 21% daily decline, suggesting a potential bounce is possible but momentum remains bearish
- 50-day MA: Estimated around $0.22–$0.24 — CARDS is trading well below this level, indicating bearish short-term structure
- 200-day MA: Estimated around $0.15–$0.17 — price is testing this critical long-term moving average, a break below would be technically significant
- Volume: Massive 24h volume of $699M (CEX: $699M, DEX: $8.68M per DeFiLlama) suggests active distribution or accumulation — the high volume on the down move suggests distribution
4H Timeframe:
- Price broke below the ascending channel that formed from the June lows
- The $0.1555 level sits at the 0.618 Fibonacci retracement of the June rally ($0.12 → $0.31)
- Next support is $0.12–$0.14 (pre-rally base); resistance is $0.20–$0.22 (psychological round number + prior consolidation)
- CMC AI price analysis on July 7 noted CARDS was "down 7.30% to $0.197 in 24h, underperforming a slightly positive broader market, primarily driven by a high-volume sell-off"
The technical picture suggests a market in price discovery to the downside after a speculative rally exhausted itself. The oversold RSI on the daily could attract dip buyers, but the trend is firmly bearish in the short term.
solana:CARDSccUMFKoPRZxt5vt3ksUbxEFEcnZ3H2pd3dKxYjp MACRO RANGE ANALYSIS
Weekly
• Support: $0.12–$0.14
• Resistance: $0.25–$0.30
• Trend: Down ~21% in 24h, consolidating below recent highs
Monthly
• Support: $0.10 (prior major support)
• Resistance: $0.38 (ATH)
• Trend: Pulling back from $0.28–$0.31 range in late June
Analysis:
CARDS is in a significant drawdown from its late-June 2026 highs around $0.28–$0.31, which followed the Maelstrom $4 price target and Solflare integration catalysts. The current ~$0.1555 level represents a ~45% decline from that local top. The token is trading well below its ATH of $0.3814 (Sep 2025) but well above its ATL of $0.0212 (Sep 2025) — representing a 7.3x return from ATL despite the recent pullback.
The monthly trend shows CARDS rallied from ~$0.20 in early June to a peak above $0.31 in late June following the Solflare integration (June 11) and Maelstrom report (week of June 22), then gave back most gains in what appears to be a post-hype profit-taking event. The $0.12–$0.14 zone represents the pre-rally support level from early June and is a critical level to hold.
MACRO BRIEFING - 8 July 2026
Stocks are bleeding as the AI trade hits a wall. QQQ dropped 1.85% to $709 -- its worst day in weeks -- after Micron flagged a 10%+ selloff in chips and headlines surfaced of an "AI infrastructure reality check." The semis rout is dragging everything: SPY -0.48% to $747.71, DIA -0.31% to $528.45. This is not rotation into value -- it's a tech-led de-risking. BofA's warning that "America now has 2 economies" (AI haves vs. rate-sensitive have-nots) crystallizes the split.
DXY at 101.06 is barely moving (-0.08%) but the 10Y yield is climbing hard -- up 3.6% on the week to 4.53%. That combo (rising yields + flat dollar) signals the bond market is pricing in a hawkish pivot. Two Fed presidents (Kashkari, Hammack) have publicly floated rate hikes in recent weeks. Bitcoin took the hit alongside risk assets: -2.23% to $62,567 as U.S.-Iran escalation pushed oil higher and traders ran for cover.
Asia tells a different story. HSI surged 2.98% to 24,198 (+5.76% weekly) on continued China stimulus optimism and a rebound in US-bound exports. SHCOMP slipped 0.15% to 3,984 -- lagging Hong Kong, suggesting foreign flows (not locals) are driving the rally.
DYOR - timing difference could happen.