When people talk about the "end of QT", many automatically think of a market that takes off like a rocket. In reality, looking at what actually happened in the past, especially in 2019, we realise it's not that simple.
When the Federal Reserve concluded QT in 2019, Bitcoin did not experience an immediate price explosion. In fact, in the following month a phase of weakness and consolidation began, with prices even falling by around 30-35%. Not because the end of QT was negative, but because that change doesn't immediately bring in new liquidity: it simply stops draining it. And for the markets, it takes time to 'feel' the difference.
It's an important point: the end of QT doesn't mean QE.
It doesn't mean fresh money is coming in.
It simply means the central bank stops removing liquidity from the system.
And indeed, the market often needs a few weeks, if not months, to understand whether that new stability will truly translate into a risk-on environment. In the case of Bitcoin, history tells us that the real bullish movement does not start immediately, but when other factors align: rates that begin to fall, confidence that returns, flows that move towards the most volatile assets. That's where BTC reacts strongly. Not "the next day".
So the message for those who follow you is simple but fundamental:
Don't expect an immediate pump just because the QT ends.
Much more often, the first reaction is a flat, slow phase or even a small retraction. The market needs time to digest the change of pace, and only then… if the macro conditions improve comes the powerful movement.
It's a useful lesson because it helps to avoid that impulsive mentality that so many in your audience have: to believe that every macro event immediately creates a trend.
The truth is that trends are born from the combination of multiple factors, not from a single ad.
And you, who work with a complete macro vision, know this well: the end of QT is a catalyst, not a trigger. It is the first step towards a softer environment, but not the immediate ignition of the bull market.
You need patience, you need context, and you need to be able to read the real liquidity - not the emotional reactions of the mass.
A top and a bottom do not arise in the same way because they arrive in two opposite emotional and technical worlds.
A top is formed when everything still seems strong: people are euphoric, buying high, wanting to participate in the last part of the trend. The price often accelerates, breaking out above the highs, everyone projects new targets and almost no one thinks about protecting themselves. Behind the scenes, however, those who have been in for months are starting to sell off, taking advantage of the enthusiasm of those who are late to the party. From the outside, it still looks like a bull market, but inside there is distribution. The final movement can be rapid, almost theatrical: final surge → sharp reversal.
A bottom, on the other hand, occurs when no one believes in it anymore. There is no enthusiasm, no FOMO, only fatigue, resignation and mistrust. People sell because they are forced to, not because they want to: stop, margin call, burnt narrative. Capitulation can be violent, but the real bottom is not that candle: it is what comes after. It is usually a flat, slow, unsexy area where volatility is crushed, volumes change quality and those who accumulate silently begin to emerge while the public no longer looks at the charts.
A top is noisy.
A bottom is silent.
The top arises from the desire not to miss the opportunity;
the bottom arises from surrender, from the fact that the masses have stopped to try.
That's why a top can be quick and euphoric , while a bottom requires time, consolidation and patience. It's a foundation that is built when everyone is mentally absent, not a perfect point that appears out of nowhere.
The RSI below is attempting to give small signs of 'exhaustion', with micro-divergences and attempts at a rebound... but these are superficial signals, linked to short-term price movements. It is an indicator that reacts to volatility, not to the real intention of the market.
The OBV, on the other hand, is totally linear and consistent:
it continues to fall without any sign of accumulation, without compression, without reversal of flow.
It is as if it were saying: 'It doesn't matter if the price rebounds here and there, serious volume is still coming out of the market.
And that's the point:
the price may lead you to believe that it is changing direction, the RSI may give you false hope, but the OBV shows you if anyone is actually buying.
That's why I've always told you to watch the OBV and not build scenarios on RSI or micro patterns.
$ETH did exactly what we expected, rebounding 11% in the marked area: it touched the deepest demand zone, took liquidity, and from there the rebound began. This is why we mark levels in advance: not to make predictions like fortune tellers, but to know where we want to act when the price gets there.
There is no need to rush now. At this stage, the important thing is to watch how the price behaves. If it does not regain and maintain key levels, any rebound may only be a pause in a still fragile trend. Understand before you act! And above all, you must act at key levels like yesterday and not in between.
The 3000-2800 range remains the most important support: as long as ETH maintains this area, the weekly structure remains healthy and intact. It is the level that separates a simple correction from a real trend change. If the price reacts and builds here, the medium-term picture remains ok
But remember one thing: a bottom cannot be guessed, it is built. It is formed over time, through increasing lows, accumulation and confirmation. It is price action that tells you when the market has truly reversed.
Good job.
$TAO is returning to a level worth watching.
After breaking the trend line and averages, the price continued to fall, but is now approaching an area where, last time, real buyers entered at 0.75 ...425/400. It is an area that the market remembers: here, demand rejected sales and changed the movement.
The reading is simple: as long as it remains at the 400 daily levels, it is acceptable... but if we see absorption and a recovery of lost levels from this support, sentiment can reverse very quickly.
$BTC has taken liquidity below the lows and now everything hinges on one key point:
if the price manages to return above the 105,500 zone and maintain it, that could be the signal for a move towards the next area, around 111,000.
The high tmf always bearish for until obv no change
There is no need to guess:
wait for the signal and follow the price.
The Monday Range is simply the area between Monday's high and low. This range shows where liquidity is concentrated at the beginning of the week. As long as the price remains within the range, the market is just preparing for movement: accumulating orders, creating traps and feigning a direction.
We only enter when there is a clear signal, after the manipulations have been 'cleaned up'.
Educational post
Many charts like this
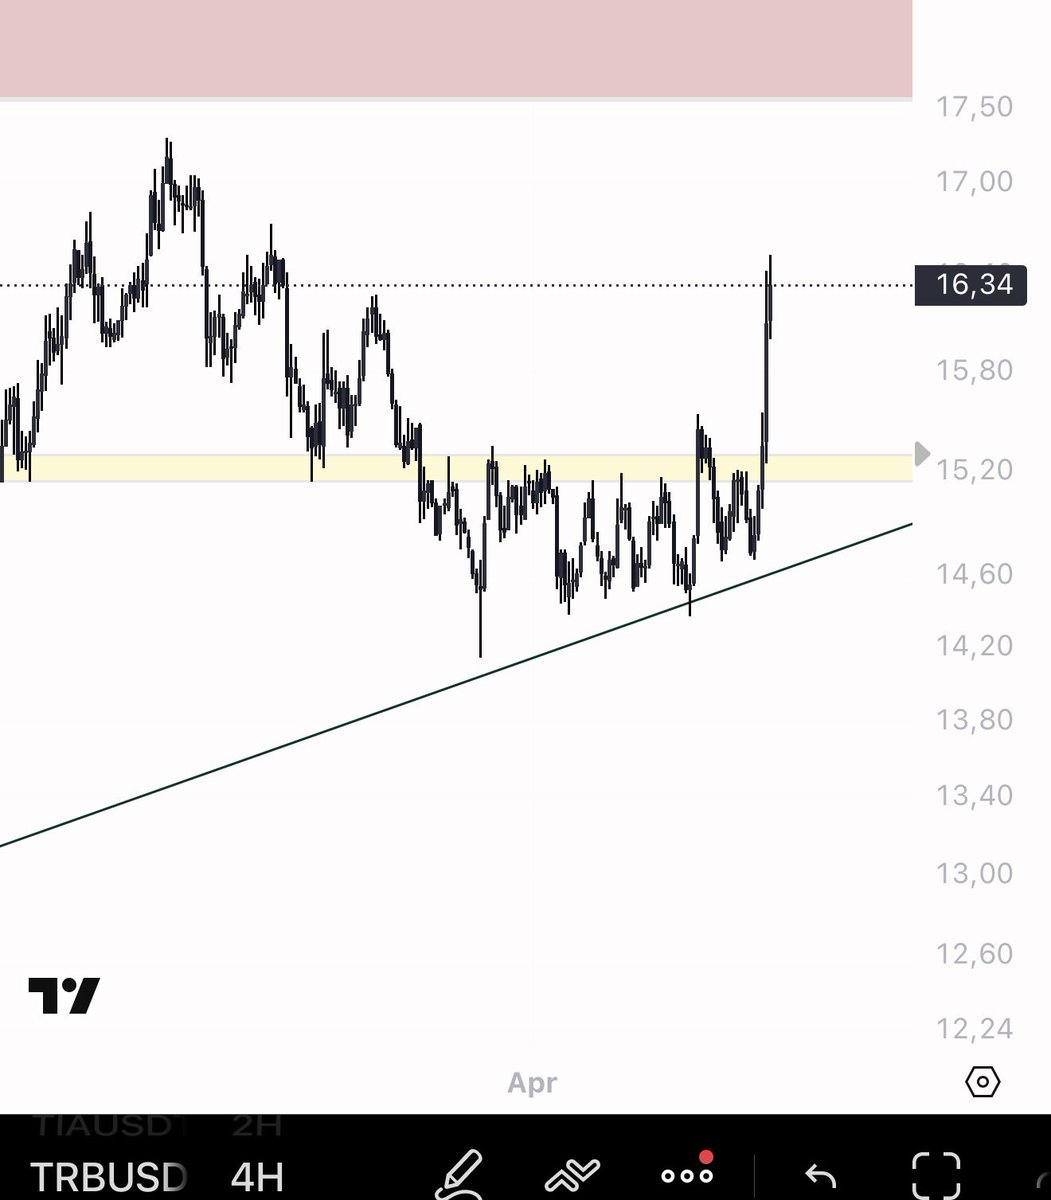
The price continues to move within a range: it is rejected at the top, and buyers always return at the bottom.
Recently, the market pushed below support only to trigger stops and create panic, but the price was immediately reabsorbed: a sign that someone was buying right there.
We are now back in the area from which significant rebounds have started in the past, but the trend remains weak. A green candle is not enough to talk about a reversal: the price needs to stop making new lows and start consolidating. Only then can we think about a return to the middle of the range and, if there is real demand, to the upper range.
Let's observe and let the price confirm.
In the second photo representing the same chart, observe how the price manages to build a three-tap on the support, three tests of the same area with rising lows and confirmation of the recovery of levels, then we will have a credible underlying structure. A single rebound is not enough: the market needs to show that every time it returns to that level, buyers respond more strongly.
And remember for a true bottom does not come from a single candlestick: it needs time and consolidation. The market must stop making new lows, move sideways, and show that there is real demand below and not just a technical rebound.
many comment on this number in my posts👌 I try to summarize in a few simple words for everyone
The Fibonacci level of 0.75 represents the point at which the market 'takes a breather' before continuing its main movement.
In this area, institutional investors gather liquidity and place orders at the best price, while emotional traders who have acted on FOMO are eliminated.
It is an area where the masses are afraid, but objective traders (converging with other analyses and technical confirmations) begin to evaluate an entry with an optimal risk/return ratio.
In summary:
0.75 is not a random level, it is an area of intelligent accumulation, where patience is an integral part of the strategy.
This is why I consider 0.75 to be a key level: I studied it years ago, when no one else was using it, and since then it has become a fundamental part of my method.
Weak vs strong structure bullish
Weak vs strong structure bearish
This simple graph is worth more than a thousand lessons
Retweet this simple and best educational contents