Data work is behind software engineering in AI adoption - but not for long.
In my recent talk at AI Council, I explored what BI looks like in a world where AI is exceptionally capable (video in comments).
The most interesting AI systems in software today are built around closed feedback loops: agents observe usage, make changes, validate outcomes, and improve over time.
The same pattern is coming to analytics.
The key prerequisite is treating analytics as code. When reports and analysis are defined in code, agents can read, write, review, and improve them just like software.
That's how we'll move from AI-assisted workflows to systems that continuously improve themselves.
I wrote a few words on one of my favorite Evidence features: deploy previews.
It’s a small thing: a link on a pull request, but it says a lot about our worldview.
Launching today: Native Warehouse Support for Snowflake, BigQuery and Fabric.
Run Evidence Studio directly on your warehouse without syncing or replicating data.
A sneak peek of our upcoming Insights feature in Evidence. Have an agent build an ad hoc analysis for you, then save it and share it with your team.
The agent has context from all your reports, so it can reuse definitions and visualizations. Or it can point you to a report that already answers your question.
Each Insight is saved with the original prompt and any methodology that went into creating the work, making it auditable and reusable.
Anthropic's Claude Opus 4.7 is now the default model in Evidence Studio.
Our AI development agent can build reports, run queries, handle ad hoc analysis, and answer questions about data lineage - all in one place.
Teams are using it to build and manage their company’s reporting systems, and to deliver high-value customer reporting. With this upgrade, they’re already seeing better development accuracy and more consistent outputs.
Link in the comments if you want to try it yourself.
AI + BI is great. But AI + BI + CI is where things get really interesting.
Here’s what that looks like in practice.
You start with a Linear issue. You assign an agent. It generates an Evidence report, opens a pull request, and sends you a link.
The code is simple and readable. It’s just markdown. You can scan it and immediately understand what’s happening.
The Evidence GitHub bot runs validation tests and adds a preview link so you can see the report before it goes live. You can merge with full confidence that nothing has broken.
This is the CI portion that most AI platforms are missing. It means you get you the speed of vibe code-able reporting, but with the governance and reliability of production software.
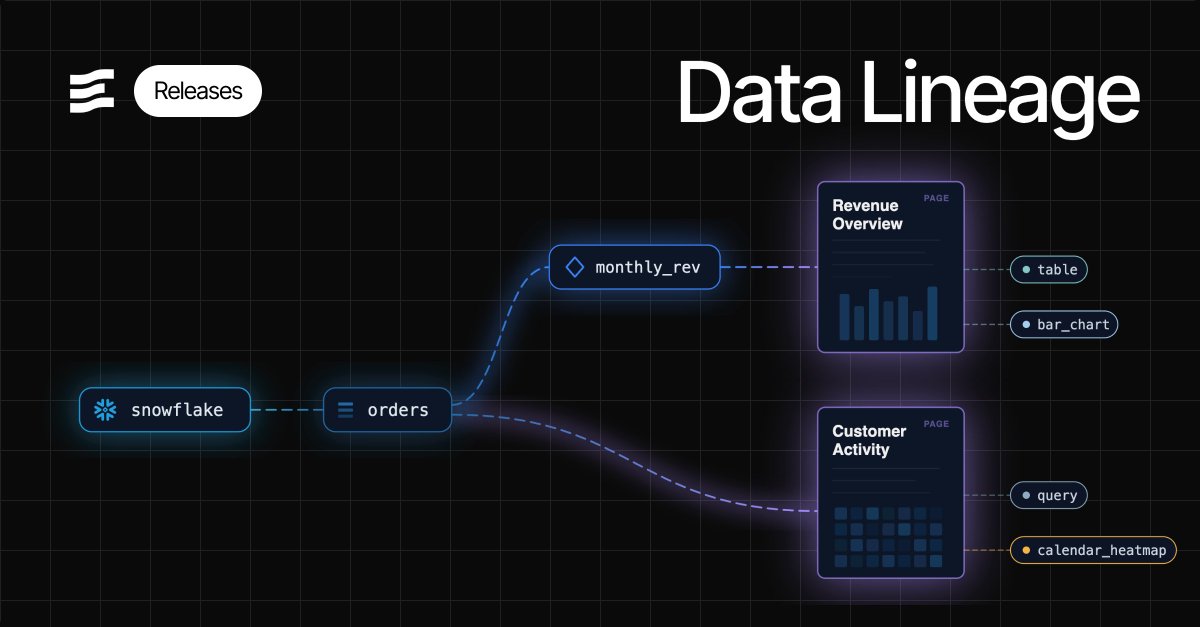
Introducing end-to-end data lineage in Evidence Studio.
Track how connections, tables, and models flow through your reports - all the way down to individual charts in your dashboards.
This is BI-as-code in action, and a key foundation for AI-generated reporting. When AI understands how everything in your reporting connects, it can take smarter actions on your behalf.
With usage analytics data in Evidence, it's becoming possible to automate the full reporting lifecycle.
Today you can build a report to recommend actions based on user data. The next step is plugging in AI to proactively recommend actions for you.
That's where we're heading and it's getting very exciting.
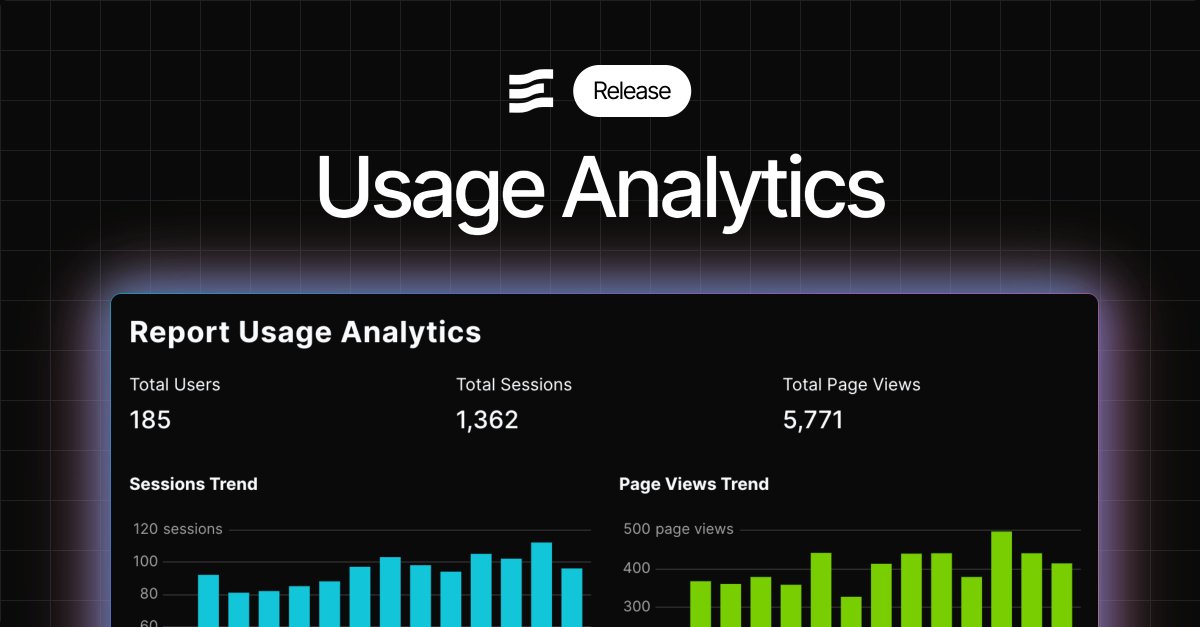
This week we rolled out Usage Analytics to enterprise customers in Evidence Studio.
See how the reports you’ve built in Evidence are actually being used - who’s viewing them, how often, and which ones get the most attention.
You also get access to the underlying data, so you can model it further or build your own analysis.
Early teams are already using this to understand adoption across internal and embedded reports.
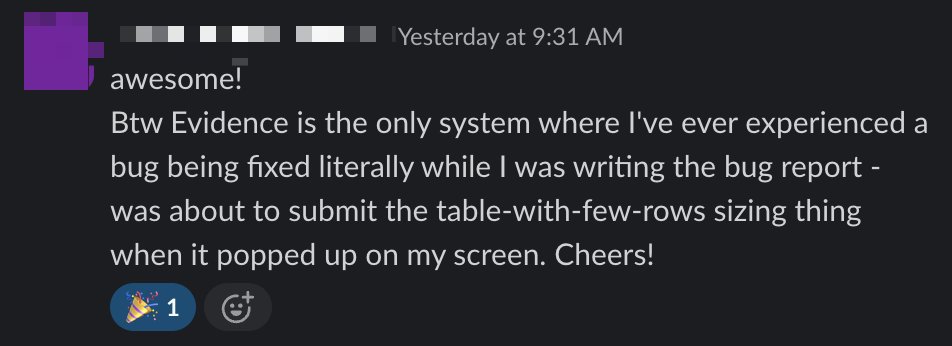
Love getting messages like this.
We consider customer feedback to be an extension of our product experience. The faster we can fix issues, the more delightful the experience of working with us.
It's an unbeatable feeling to see it working for customers.
New in Evidence Studio: Collapsible tables.
Row groups can now expand and collapse, so you can fit a lot more information into the same space - without turning your page into a wall of data.
Most product bugs don't get reported. They're just small enough that customers work around them and move on.
We built our AI assistant to flag these automatically. It sits in customer workflows, sees where things break down, and opens issues for us without anyone asking.
Yesterday I started my morning reviewing problems it had surfaced overnight.
Nothing dramatic - confusing flows, missing docs, edge cases. The kind of stuff that individually doesn't matter but collectively degrades the experience.
We fixed them same-day and looped in the affected customers.
This feedback loop is working well enough for our team that we're now building ways for our customers to create similar loops with the data products they build in Evidence.
AI can easily handle tedious but necessary work - like keeping analytics well documented.
In Evidence, our AI assistant can join data from multiple sources, calculate metrics like conversion rates, and document the logic as it goes. Since Evidence already has strong documentation features built in, that context sticks around instead of living in someone’s head or a random notebook.
The result is faster answers with clearer reasoning. Feels like a glimpse into how data teams will work in the future.
To build this table, we gave the AI assistant 10 mock datasets and asked it to create a conversion funnel. It identified the right tables, columns, and filters automatically, and included definitions directly in the column headers.
Dense tables are sometimes overlooked in favour of charts, but they’re often the fastest way to understand complex data.
We put a lot of effort into making our tables feel publication-quality and easy to scan. One small but high-impact thing we just shipped is column groups.
You can now group related columns under a shared header (like Revenue or Volume in this example), which makes wide tables much easier to read at a glance. Adding a column to a group is intentionally simple and doesn’t require any extra layout work.
It’s a small feature, but it makes dense data feel way more approachable when you’re actually reading it.
We’ve been working on a cleaner way to make reports interactive, and added variables you can insert anywhere in @evidence_dev.
Inputs like sliders or dropdowns generate a variable you can reference in SQL, charts, or even plain markdown.
Change an input, and anything using that variable updates instantly.
You can parameterize almost anything - including number formats and table/column references
A week ago, we rebuilt our AI assistant from the ground up, and the results so far have been pretty amazing.
From a customer:
“Massive upgrade. I recommend all Evidence devs try it out for edits now.”
What changed:
- A new Evidence docs MCP
- Claude Opus 4.5 as the primary model under the hood
- Deep project awareness, so it can:
- Query and analyze your data
- Summarize what it sees on the page
- Write Evidence markdown and SQL
- Update page and project settings directly from chat (incl. themes)
- Send feature requests and bug reports to the Evidence team
Next up:
- Validation and feedback loops to keep pushing the success rate higher
- A CLI that lets you use your own AI model to work on Evidence Studio reports
The end goal: vibe-coding reports that are validated, governed, and production-ready - all inside Evidence.
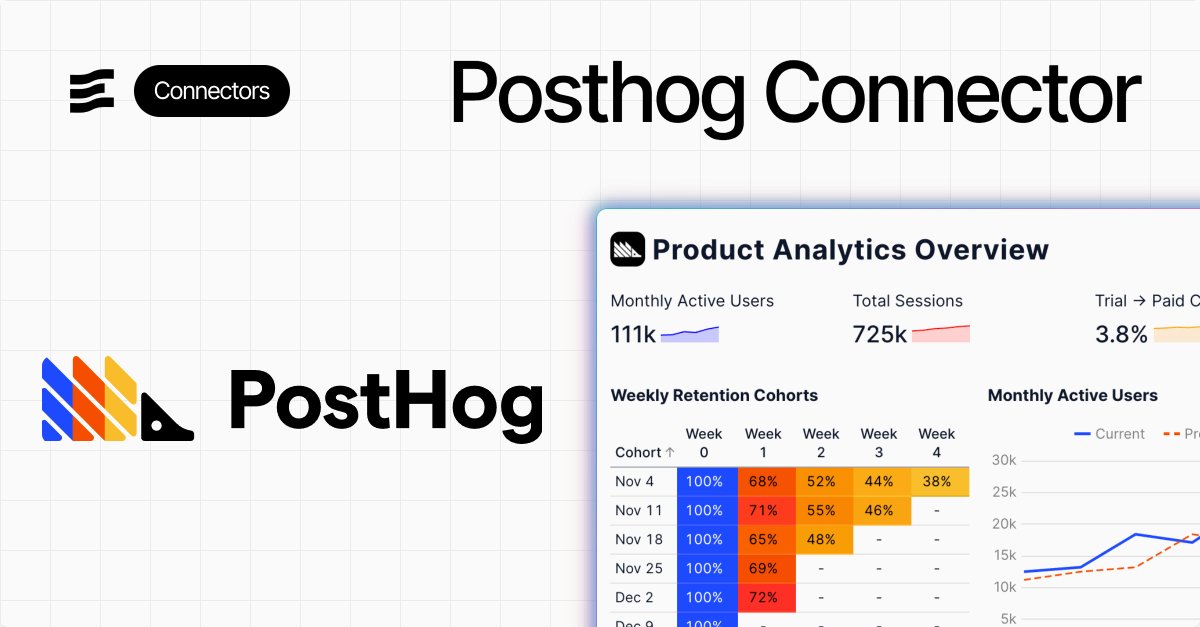
Connect Linear, sync your data, and use it to build reports in Evidence.
Common use cases include engineering velocity, backlog health, cycle time, and team-level reporting.
Available now.