Real Estate Agent | Tri-Valley & San Ramon Valley Homes | Buying • Selling • Investing | 25+ Years | East Bay Market Expert | Father | Husband | Sport Fanatic
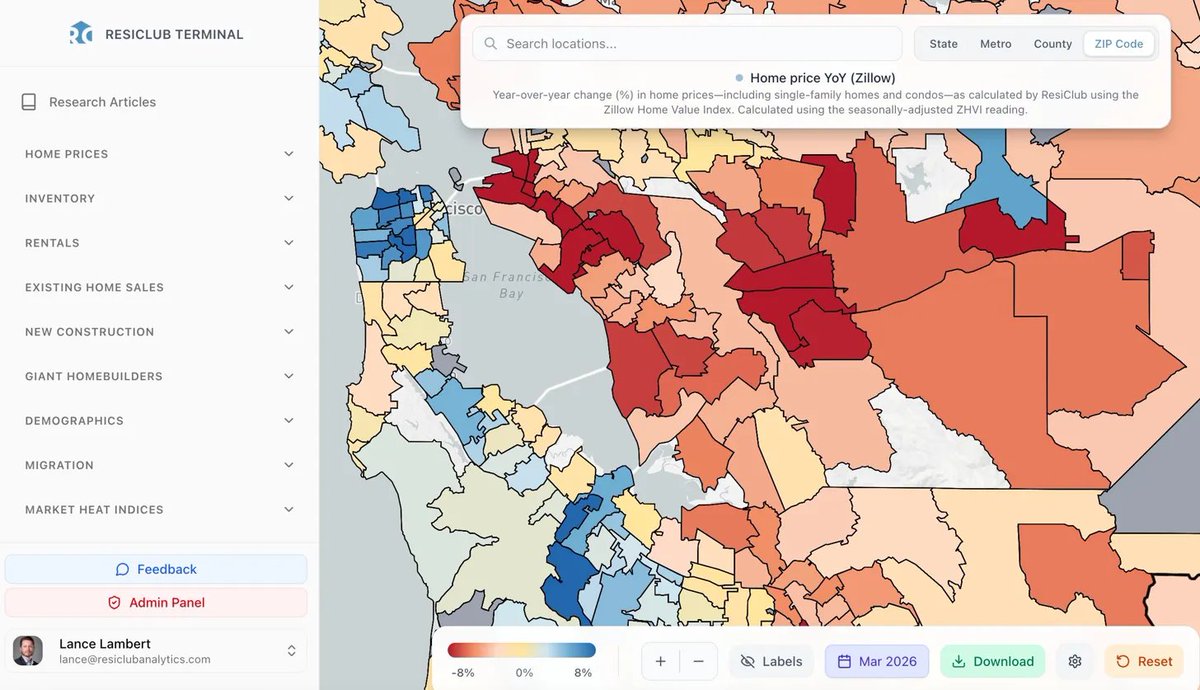
The Bay Area housing market
LEFT: Home price shift between spring 2024 to spring 2025
RIGHT: Home price shift between spring 2025 to spring 2026
Spillover from the AI Boom into housing was a little stronger a year ago in San Jose than now—however, it's the opposite in San Francisco—with much more upswing this year. Oakland is weaker—buyers have gained leverage there.
via ResiClub Terminal
The average 30-year fixed mortgage rate on April 22, by year
4.58% -> April 22, 2018
4.35% -> April 22, 2019
3.43% -> April 22, 2020
3.14% -> April 22, 2021
5.38% -> April 22, 2022
6.66% -> April 22, 2023
7.43% -> April 22, 2024
6.98% -> April 22, 2025
6.32% -> April 22, 2026
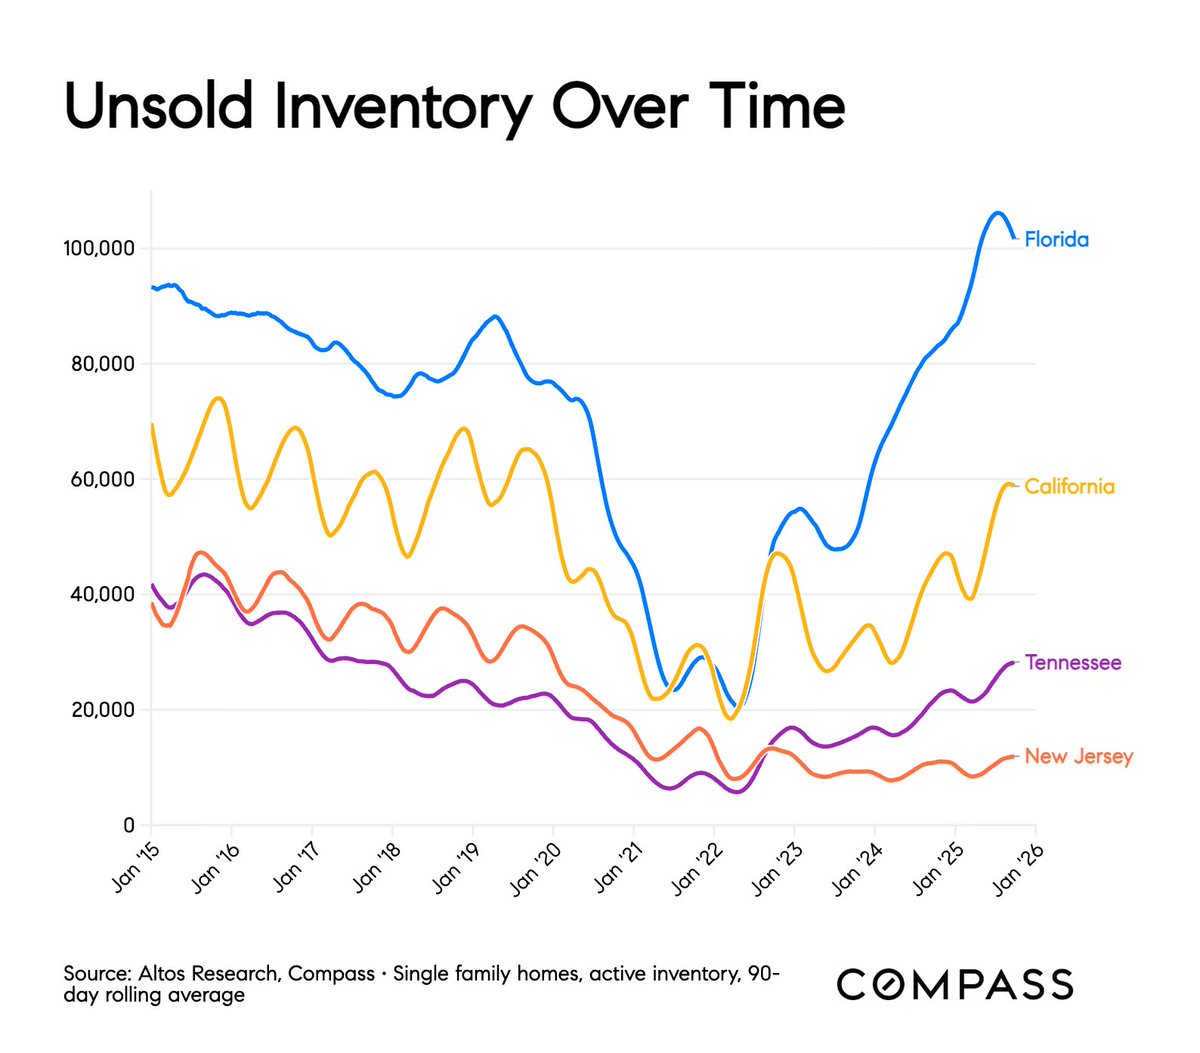
Nobody forecasted US home inventory shrinking in 2026, but the latest data is in and that's where it is pointing!
➡️941,000 homes on the market nationally, unchanged from last week and only 2.7% above last year. At this pace, we could have fewer homes available than a year ago by May.
➡️35 states still have less inventory than 2019, and 2019 was already a shortage
➡️Illinois has 75% fewer homes for sale than 2019. Florida is 12% below last year.
➡️Dallas just flipped negative YoY inventory
➡️Median list price is $440K, down from $450K last year
➡️Payments on the median home are 4.5% cheaper than a year ago, yet demand remains fragile
Rate volatility from the current macro environment is the biggest wildcard. The latest trends could reverse quickly.
full details in the video: https://t.co/mLY1nz0iKu
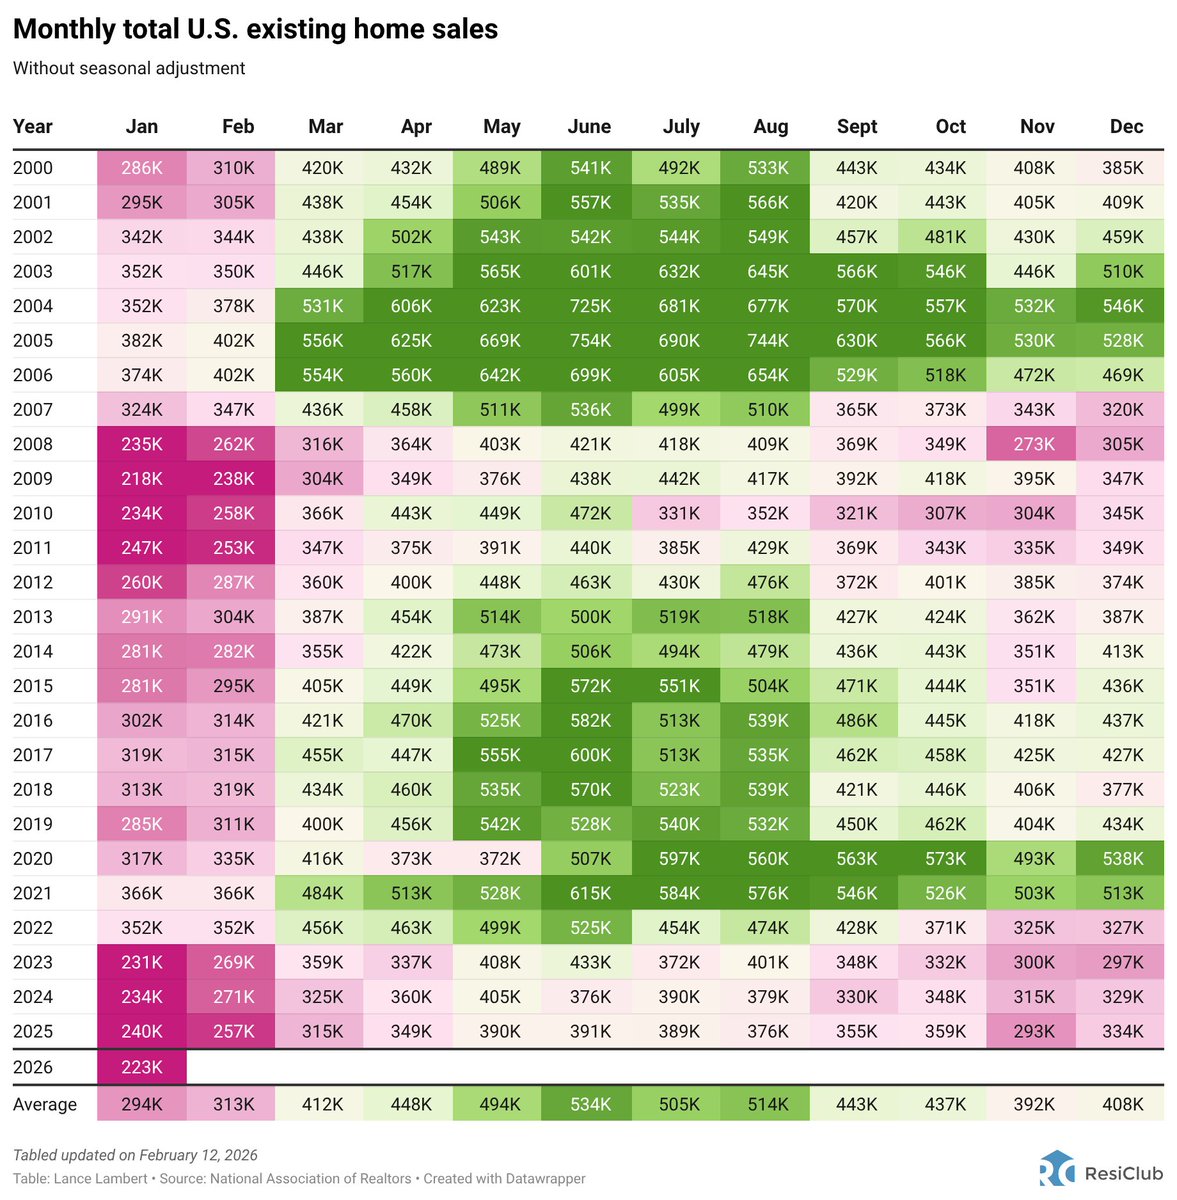
U.S. existing home sales totaled 223K in January 2026
That's the lowest January existing sales volumes since 2009
Turnover remains strained in the existing-home market
Net domestic migration per 1,000 residents
BLUE = counties seeing more Americans move IN than move out
YELLOW = counties seeing more Americans move OUT than move out
Screen shot via the ResiClub Terminal
#NEW Final 2025 calendar year shift in home prices for the nation's 50-year largest metro area housing markets
YoY = Year-over-year
Want to stay updated on the U.S. housing market? Subscribe to the free version of ResiClub's newsletter here: https://t.co/0pFIA4zn0x
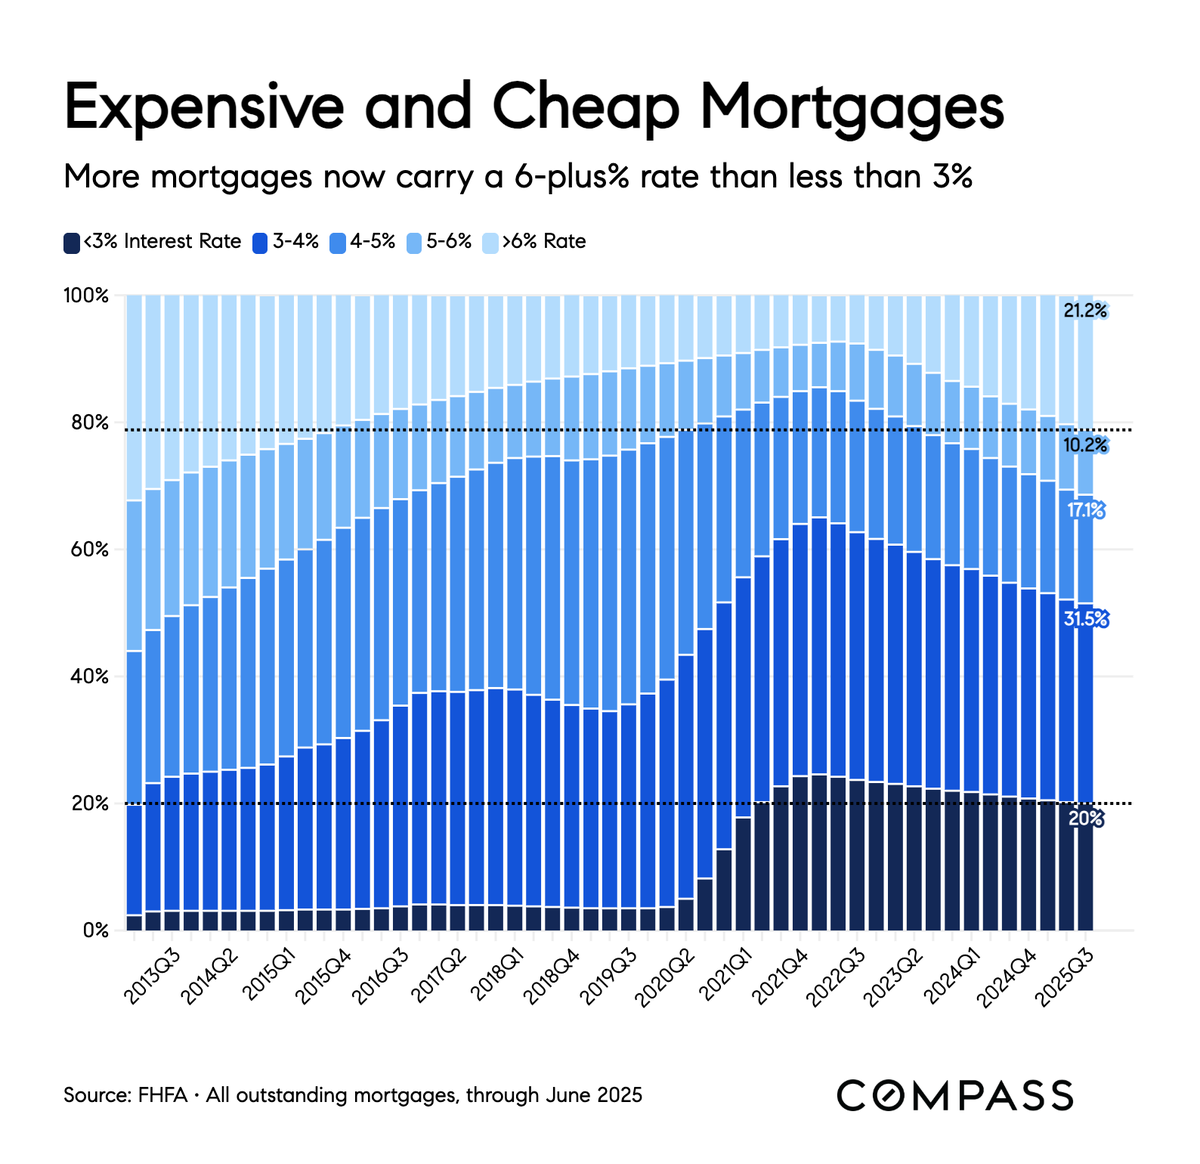
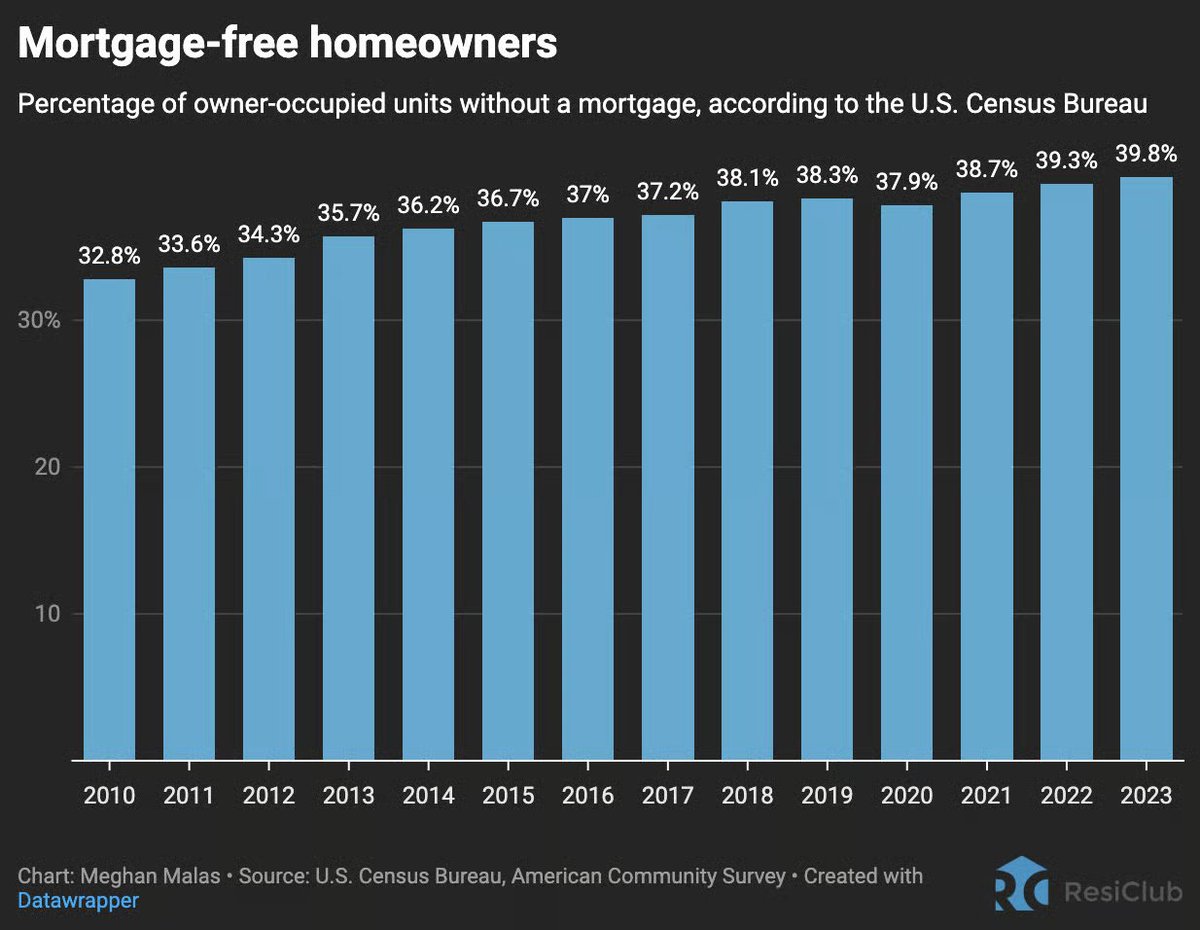
I've been sharing this trend for a while, and now the data is in:
More Americans now have an over-6% mortgage than have under 3%.
Those groups will behave very differently in the future!
The biggest home price declines are hitting the markets that overheated most during the Pandemic Housing Boom
My latest for ResiClub: https://t.co/W9EzbmWI4l
Active U.S. housing inventory for sale:
April 2017 --> 1,198,424
April 2018 --> 1,102,064
April 2019 --> 1,137,198
April 2020 --> 941,733
April 2021 --> 435,663
April 2022 --> 379,978
April 2023 --> 562,966
April 2024 --> 734,318
April 2025 --> 959,251